
Tennessee – Accountability
The Every Student Succeeds Act (ESSA) is the latest reauthorization of the Elementary and Secondary Education Act of 1965. ESSA requires states to submit plans to the U.S. Department of Education (US ED) describing the state systems for evaluating school performance and holding schools accountable for improvement. States could submit their plans to the US ED by either April 3 or September 18, 2017. After receiving feedback on their plans from the US ED, states finalize their plans. State accountability systems take effect in school year 2017-18.
SREB developed this profile based on analysis of the Tennessee plan approved by the US ED on August 30, 2017. As of June 11, 2018, Tennessee anticipates making further adjustments to its plan based on state legislation enacted in 2018 and pending further US ED approval.
State Highlights: Expectations for College and Career Readiness
States are not required to include college- and career-readiness expectations in their accountability systems under ESSA. Many SREB states, however, did set college- and career-readiness expectations in their plans, in the form of long-term goals and school performance indicators. Tennessee included the following college- and career-readiness expectations in its plan.
- Long-term goals. ESSA requires that states establish long-term goals based on academic achievement, high school graduation rate and English language proficiency for English learners. In addition to setting goals in these areas, Tennessee also established two goals:
- By 2020, the state’s average ACT composite score will be 21.
- By 2020, the majority of high school graduates will earn a postsecondary certificate, diploma or degree.
- School performance indicators.
- Academic achievement. ESSA requires states to specify indicators for the performance of all schools that include academic achievement as measured by proficiency on annual state assessments of English language arts and math in grades three through eight and once in high school. Tennessee established a proficiency level on the state exams to indicate that a student performing at that level is on track for success in a postsecondary setting. The state uses data on student attainment of that level in calculating school performance on the academic achievement indicators. For high schools, Tennessee also includes use of the ACT exam.
- School quality or student success. ESSA requires states to set an indicator for school quality or student success, which can but does not have to include such measures as school climate and safety, student engagement and college readiness. Tennessee’s indicator for high schools measures each school’s rate of producing “ready graduates,” by multiplying the four-year graduation rate by the percentage of graduates meeting one of the following milestones.
- Earning a composite score of 21 or higher on the ACT exam, or the equivalent on the SAT
- Completing four early postsecondary opportunities (EPSOs), such as AP, IB, and dual credit or enrollment courses
- Completing two EPSOs and earning an industry certificate
Read about these expectations below in the profile.
Long-Term Goals
The Every Student Succeeds Act requires that states establish long-term goals for all students and student groups based on academic achievement, high school graduation rate and English language proficiency for English learners.
Tennessee established the following long-term goals.
Academic achievement
- By 2019, the state will rank in the top half of states on the National Assessment of Educational Progress.
- By 2025, 75 percent of third-graders will be proficient in reading on the state’s annual English language arts test.
- By 2024-25, the number of students not meeting the “on-track” or “mastered” level on the state’s annual English language arts, math and science assessments will decline by 50 percent.
Graduation rate
- By 2025, 95 percent of students will graduate from high school in four years.
English language proficiency
- By 2024-25, 75 percent of English learners will meet the annual growth standard on the state English language proficiency assessment.
College and career readiness
- By 2020, the state’s average ACT composite score will be 21.
- By 2020, the majority of high school graduates will earn a postsecondary certificate, diploma or degree.
School Performance Indicators
ESSA specifies a set of indicators states must use to assess school performance. Indicators for all schools must include academic achievement as measured by proficiency on annual state assessments of English language arts and math in grades three through eight and once in high school. States must require 95 percent of students to participate in these assessments and factor this requirement into the school accountability system. States must also include two more indicators for all schools – English language proficiency for English learners and an indicator of school quality or student success, such as school climate and safety, student engagement and college readiness. For elementary and middle grades schools, states must include an additional academic indicator of the state’s choice, such as student growth on state assessments. For high schools, states must also include an indicator of four-year cohort graduation rate.
Tennessee established the following indicators of school performance.
| Level | Indicators |
|
All schools |
Academic achievement: Schools must meet the 95 percent participation rate for all students and subgroups English language proficiency
School quality or student success: Attendance – rates of chronic absenteeism, including out-of-school suspensions |
|
Elementary and middle grades |
Academic achievement: Proficiency, either absolute or improvement, on state English language arts, math and science assessments – TNREADY Other academic indicator: Student growth on state English language arts, math and science assessments – TNREADY |
|
High schools |
Academic achievement
Graduation rate
School quality or student success: Ready Graduate measure, calculated by multiplying the four-year high school graduation rate by the percentage of graduates meeting one of the following milestones.
|
Annual Meaningful Differentiation
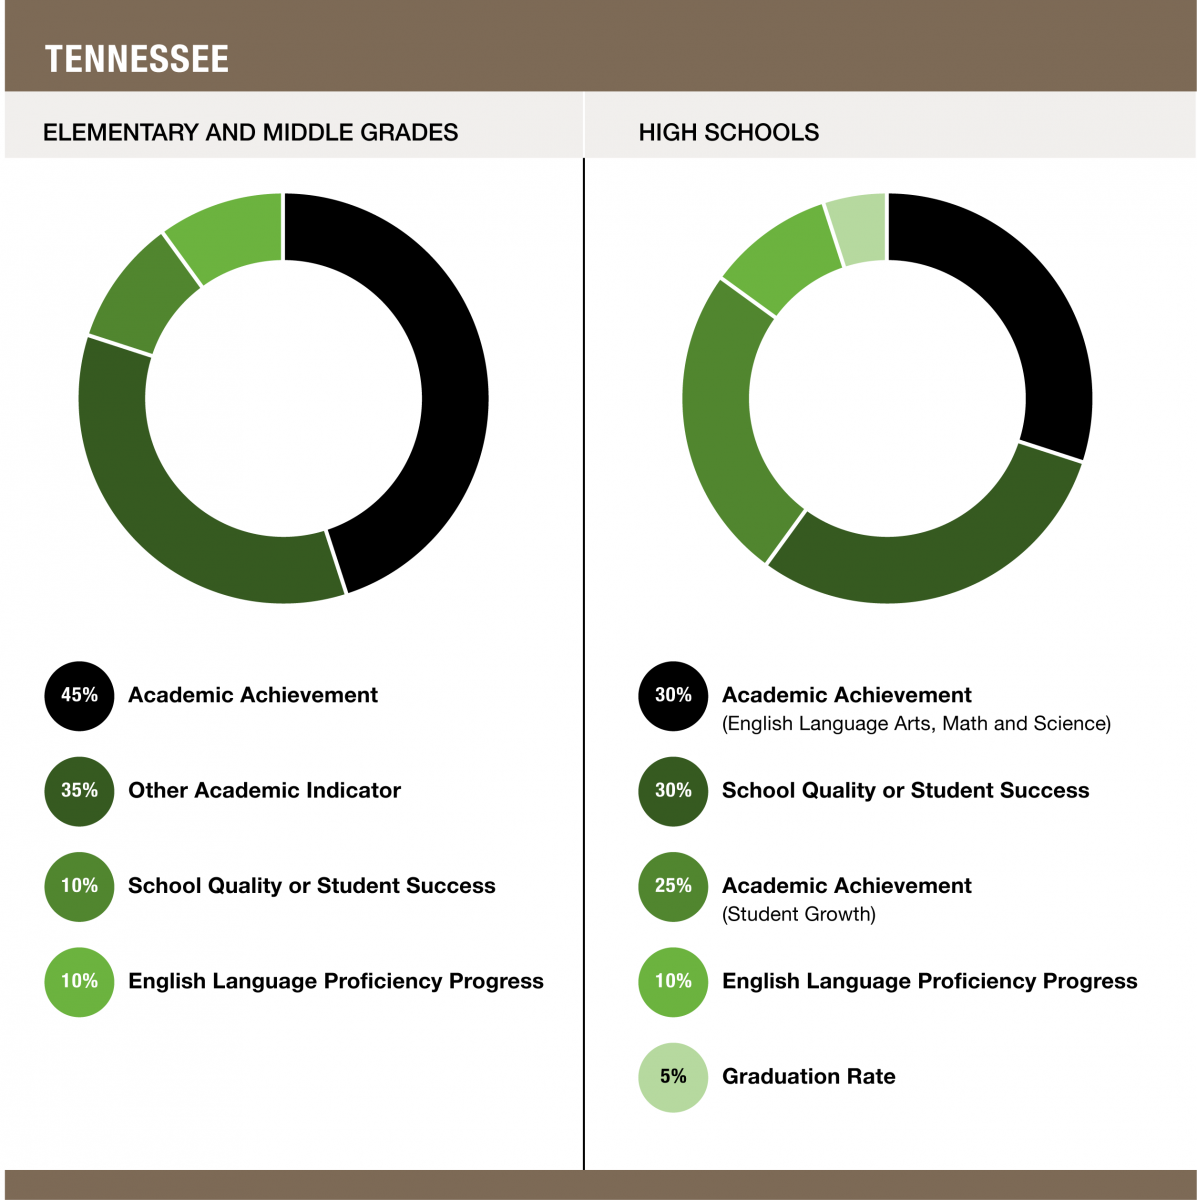
The Every Student Succeeds Act requires that states use their performance indicators to differentiate the performance of all schools and to report performance for all students and all student subgroups. States have flexibility in assigning weight to their indicators, so long as their indicators of academic achievement, graduation rate and English language proficiency progress together receive much greater weight than their school quality or student success indicators.
Tennessee established the following framework for differentiating schools, weights for each indicator, and student subgroups.
Framework for differentiating schools in Tennessee
On an annual basis, schools will receive a numeric rating for each of the indicators of school performance in the school accountability framework. Based on the 2017-18 year, Tennessee will identify Reward and Priority schools. Subsequently, Tennessee will identify Reward, Priority, and Focus schools.
Weights assigned to each indicator in Tennessee
Student subgroups in Tennessee
- Subgroups:
- For state accountability, Tennessee will focus on four student groups: economically disadvantaged students, students with disabilities, English learners and a combined student group of black, Hispanic, and Native American students. Tennessee’s plan notes that black, Hispanic and Native American students have historically scored the lowest on state assessments. Based on this, Tennessee identified these three groups as the state’s major racial and ethnic subgroups for accountability under ESSA. Using this approach, Tennessee intends to hold more schools accountable for the performance of these students, including schools that do not have enough black, Hispanic and Native American students to meet the n-count for each group on its own. (See “Size of subgroups” below.)
- However, to identify schools for targeted support and improvement and additional targeted support and improvement under ESSA (described below), Tennessee will use all six federally-recognized racial and ethnic subgroups – Asian students, black students, Hawaiian or Pacific islander students, Hispanic or Latino students, native American students, and white students – in addition to the black, Hispanic and Native American combined group.
- Size of subgroups:
- In instances in which schools do not meet the threshold of 30 students (n-count) for any of the four accountability student groups – economically disadvantaged students, students with disabilities, English learners and the combined black, Hispanic and Native American student group – the school will be held accountable for the performance of students in these groups through a combined student group that will include any student who is a member of any these groups.
- In instances in which a school has an n-count of fewer than 10 students in any of the student groups, the student group results will not be reported publicly.
- Use of subgroup data in school ratings: Tennessee uses student group performance data to identify schools for targeted support and improvement and additional targeted support and improvement (TSI, see below) and publicly reports student group performance data for each indicator, as required by ESSA. Additionally, Tennessee factors student group performance into the school accountability ratings for each indicator. Also, schools identified for TSI or additional TSI cannot be identified as “Reward Schools.”
Identifying, Serving and Exiting Schools from Needs Improvement Status
ESSA requires that states establish a methodology for identifying low-performing schools. States must identify two categories of schools at least once every three years: those that need Comprehensive Support and Improvement (CSI) and those that need Targeted Support and Improvement (TSI). States may also establish other categories of schools, for example those not in need of improvement.
Tennessee established the following identification and exit criteria, and interventions to support schools.
| Comprehensive Support and Improvement | |
|
How schools are identified |
Called “priority schools” in Tennessee. Identified every three years beginning in 2017-18, any schools that meet any of the following criteria.
|
|
Interventions to meet improvement needs |
State will provide the following interventions, based on the following school tracks.
|
|
Criteria for exiting this category |
Schools can exit CSI status if they meet the following criteria.
|
| Targeted Support and Improvement | |
|
How schools are identified |
Called “Focus” schools in Tennessee.
Schools identified will not be eligible for Reward status. |
|
Interventions to meet improvement needs |
|
|
Criteria for exiting this category |
After one year, schools can exit TSI status by:
|
| Other categories of schools | |
|
Reward schools |
Identified annually since 2012, schools earning an overall rating of 3.1 or greater based on the weighted average of each indicator through any of the following criteria.
There are no interventions for reward schools. |
This profile was prepared by Kim Anderson, SREB’s director of benchmarking college- and career-readiness standards, Mary Elizabeth Mira, SREB’s assistant director of benchmarking college- and career-readiness standards, Tiffany Harrison, SREB’s research associate for benchmarking college- and career-readiness standards and Jeff Gagné, SREB’s director of policy analysis. For more information, please contact Kim Anderson at kim.anderson@sreb.org or Jeff Gagné at jeff.gagne@sreb.org.