
Teacher Preparation Program Completion
Total by State, 2012-13, 2016-17, 2017-18 and 2018-19
In the SREB region, nearly 15,000 fewer teacher candidates completed teacher preparation programs in 2019 than in 2013, and all SREB states saw overall declines in program completion in the last decade.
Top orange bar: 2012-13
Second yellow bar: 2016-17
Third blue bar bar: 2017-18
Bottom brown bar: 2018-19 (the most recent available data)
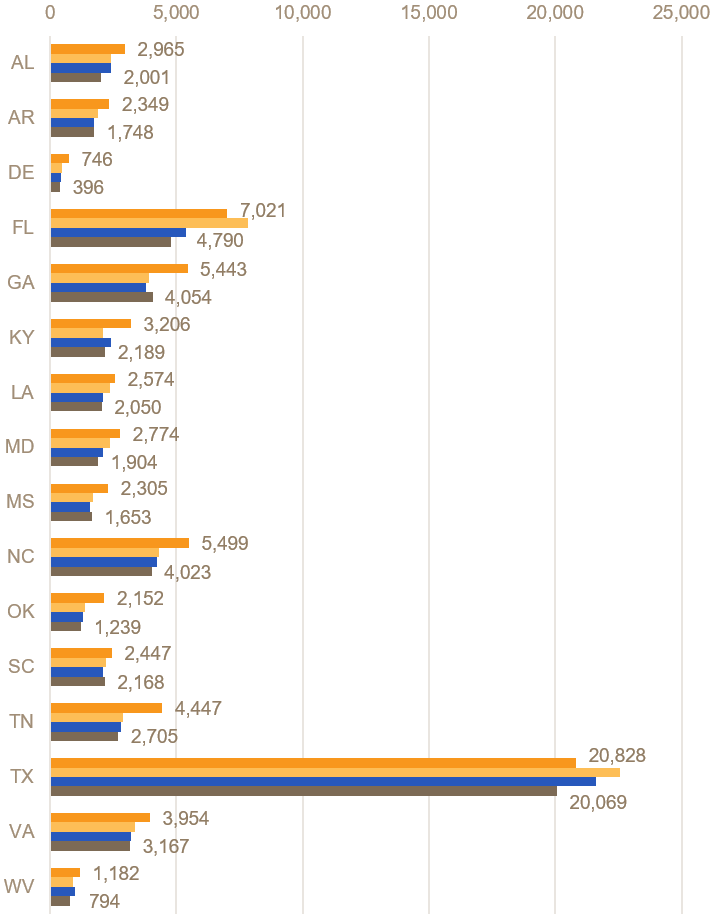
Includes teacher candidates who completed traditional teacher preparation programs and university-based and private alternative teacher preparation programs.
Source: U.S. Department of Education. “2018 Title II Reports.”