
Georgia – Accountability
The Every Student Succeeds Act (ESSA) is the latest reauthorization of the Elementary and Secondary Education Act of 1965. ESSA requires states to submit plans to the U.S. Department of Education (US ED) describing the state systems for evaluating school performance and holding schools accountable for improvement. States could submit their plans to the US ED by either April 3 or September 18, 2017. After receiving feedback on their plans from the US ED, states finalize their plans. State accountability systems take effect in school year 2017-18.
SREB developed this profile based on analysis of Georgia’s plan approved by the US ED on January 19, 2018.
State Highlights: Expectations for College and Career Readiness
States are not required to include college- and career-readiness expectations in their accountability systems under ESSA. Many SREB states, however, did set college- and career-readiness expectations in their plans, in the form of long-term goals and school performance indicators. Georgia included the following college- and career-readiness expectations in its plan.
School performance indicators:
- Academic achievement. ESSA requires states to specify indicators for the performance of all schools that include academic achievement as measured by proficiency on annual state assessments of English language arts and math in grades three through eight and once in high school. Georgia established a proficiency level on the state exams to indicate that a student performing at that level is on track for success in a postsecondary setting. The state uses data on student attainment of that level in calculating school performance on the academic achievement indicators.
- School quality or student success. ESSA requires states to set an indicator for school quality or student success, which can but does not have to include such measures as school climate and safety, student engagement and college readiness. Georgia’s indicator of school quality or student success awards points to schools for the following college- and career-readiness measures.
- All schools
- Reading readiness, as determined by Lexile benchmarks on state English language arts assessment
- Attendance, as measured by rates of chronic absenteeism
- Elementary and middle grades
- Beyond the Core: Earned credit in enrichment or well-rounded curriculum courses, for example, world languages, career pathway, physical education, health or fine arts
- High schools
- Accelerated Enrollment: Earned credit in advanced coursework, such as AP, IB or dual enrollment
- Pathway Completion: Completion of a career pathway, for example, in world languages, career and technical education or fine arts
- College and Career Readiness
- Student exemption from remediation at a state postsecondary institution
- Score of 22 or higher on ACT exam; scores on SAT exam of 480 in English language arts and 530 in math or higher; score of 3 or higher on two or more AP exams; or score of 4 or higher on IB exam
- Attainment of a national or state industry credential
- Completion of a work-based learning experience
- All schools
Read about each of these expectations below in the profile.
Long-Term Goals
The Every Student Succeeds Act requires that states establish long-term goals for all students and student groups based on academic achievement, high school graduation rates and English language proficiency for English learners.
Georgia established the following long-term goals.
Academic achievement
- Between 2017 and 2032, the gap between baseline student performance and 100 percent proficiency on Georgia’s English language arts, math, science and social studies assessments will decline by 45 percent.
Graduation rate
- Between 2017 and 2032, the gap between the baseline four- and five-year high school graduation rates and 100 percent will decline by 45 percent.
English language proficiency
- Between 2017 and 2032, the gap between the baseline and 100 percent of English learners meeting annual growth targets on the state English language arts assessment will decline by 45 percent.
School Performance Indicators
ESSA specifies a set of indicators that states must use to assess school performance. Indicators for all schools must include academic achievement as measured by proficiency on annual state assessments of English language arts and math in grades three through eight and once in high school. States must require 95 percent of students to participate in these assessments and factor this requirement into the school accountability system. States must also include two more indicators for all schools – English language proficiency for English learners and an indicator of school quality or student success, such as school climate and safety, student engagement and college readiness. For elementary and middle grades schools, states must include an additional academic indicator of the state’s choice, such as student growth on state assessments. For high schools, states must also include an indicator of four-year cohort graduation rate.
Georgia established the following indicators of school performance.
| Level | Indicators |
|
All schools |
Academic achievement: Schools must meet the 95 percent participation rate for all students and subgroups English language proficiency: Progress towards English proficiency on state assessment – WIDA ACCESS for ELLs 2.0 School quality or student success: Readiness
|
|
Elementary and middle grades |
Academic achievement: Weighted achievement on state English language arts, math, science and social studies assessments – Georgia Milestones end-of-grade tests Other academic indicator:
School quality or student success: Readiness
|
|
High schools |
Academic achievement
Graduation rate
School quality or student success:
|
Annual Meaningful Differentiation
The Every Student Succeeds Act requires that states use their performance indicators to differentiate the performance of all schools and to report performance for all students and all student subgroups. States have flexibility in assigning weight to their indicators, so long as their indicators of academic achievement, graduation rate and English language proficiency progress together receive much greater weight than their school quality or student success indicators.
Georgia established the following framework for differentiating schools, weights for each indicator, and student subgroups.
Framework for differentiating schools in Georgia
On an annual basis, schools will receive an overall numeric score (0 to 100), based on the sum of the numeric score for each indicator.
Weights assigned to each indicator in Georgia
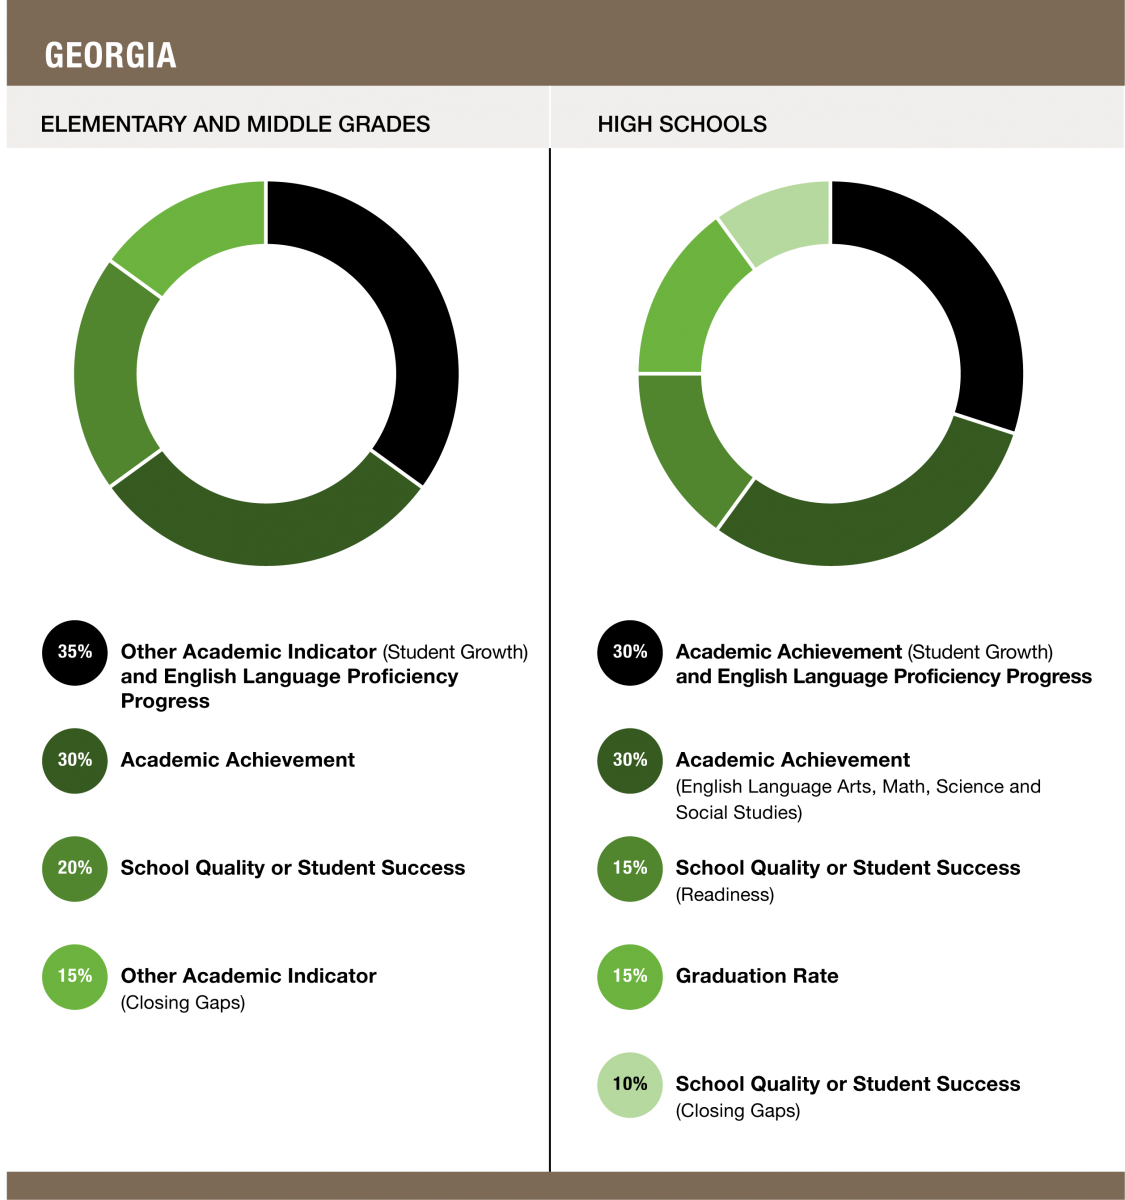
Note. At the elementary and middle levels, English language arts and math comprise 75 percent of the academic achievement indicator, and science and social studies comprise 25 percent. At the high school level, these four content areas each comprise 25 percent of the academic achievement indicator. The English language proficiency progress indicator is combined with the other academic indicator at the elementary and middle levels, and with the academic achievement (student growth) indicator at the high school level, and is weighted at 10 percent. At the high school level, the four-year graduation rate comprises two-thirds of the weight, and the five-year graduation rate comprises one-third of the weight.
Student subgroups in Georgia
- Subgroups: In calculating state accountability ratings, Georgia will use nine student subgroups – economically disadvantaged students, students with disabilities, English learners, American Indian or Alaska native students, Asian or Pacific islander students, black students, Hispanic or Latino students, multi-racial students, and white students. For the overall school score, Georgia will report subgroup performance but not factor it into the score.
- Size of subgroups: In instances in which schools do not meet the threshold of 15 students (n-count) for any of the subgroups for an indicator, the school will not be held accountable for performance on that indicator.
- Use of subgroup data in school ratings: Georgia uses subgroup performance data to identify schools for targeted support and improvement (TSI, see below) and publicly reports subgroup performance data for each indicator, as required by ESSA. Additionally, Georgia factors subgroup performance into overall school ratings, by including the dedicated “closing gaps” measure (see above) in the ratings calculations.
Identifying, Serving and Exiting Schools from Needs Improvement Status
The Every Student Succeeds Act requires that states establish a methodology for identifying low-performing schools. States must identify two categories of schools at least once every three years: those that need Comprehensive Support and Improvement (CSI) and those that need Targeted Support and Improvement (TSI). States may also establish other categories of schools, for example those not in need of improvement.
Georgia established the following identification and exit criteria, and interventions to support schools.
| Comprehensive Support and Improvement | |
|
How schools are identified |
Identified annually beginning in 2018-19, schools that meet any of these criteria:
|
|
Interventions to meet improvement needs |
State will help local education agencies and their schools by providing:
For schools not exiting CSI status after multiple years, the state education agency may require more rigorous state interventions, including being designated a state-run turnaround school. |
|
Criteria for exiting this category |
After one year, schools can exit CSI status by:
|
| Targeted Support and Improvement | |
|
How schools are identified |
Identified annually beginning in 2018-19, schools that meet any of these criteria:
|
|
Interventions to meet improvement needs |
State will help local education agencies in supporting their schools through:
|
|
Criteria for exiting this category |
After one year, schools can exit TSI status by:
|
| Other categories of schools | |
|
At-risk for CSI and TSI Schools exiting CSI, TSI or turnaround status that require additional supports to sustain improvement Schools failing to meet charter or strategic waiver performance goals |
Identified annually beginning in 2018-19:
|
This profile was prepared by Kim Anderson, SREB’s director of benchmarking college- and career-readiness standards, Mary Elizabeth Mira, SREB’s assistant director of benchmarking college- and career-readiness standards, Tiffany Harrison, SREB’s research associate for benchmarking college- and career-readiness standards and Jeff Gagné, SREB’s director of policy analysis. For more information, please contact Kim Anderson at kim.anderson@sreb.org or Jeff Gagné at jeff.gagne@sreb.org.