
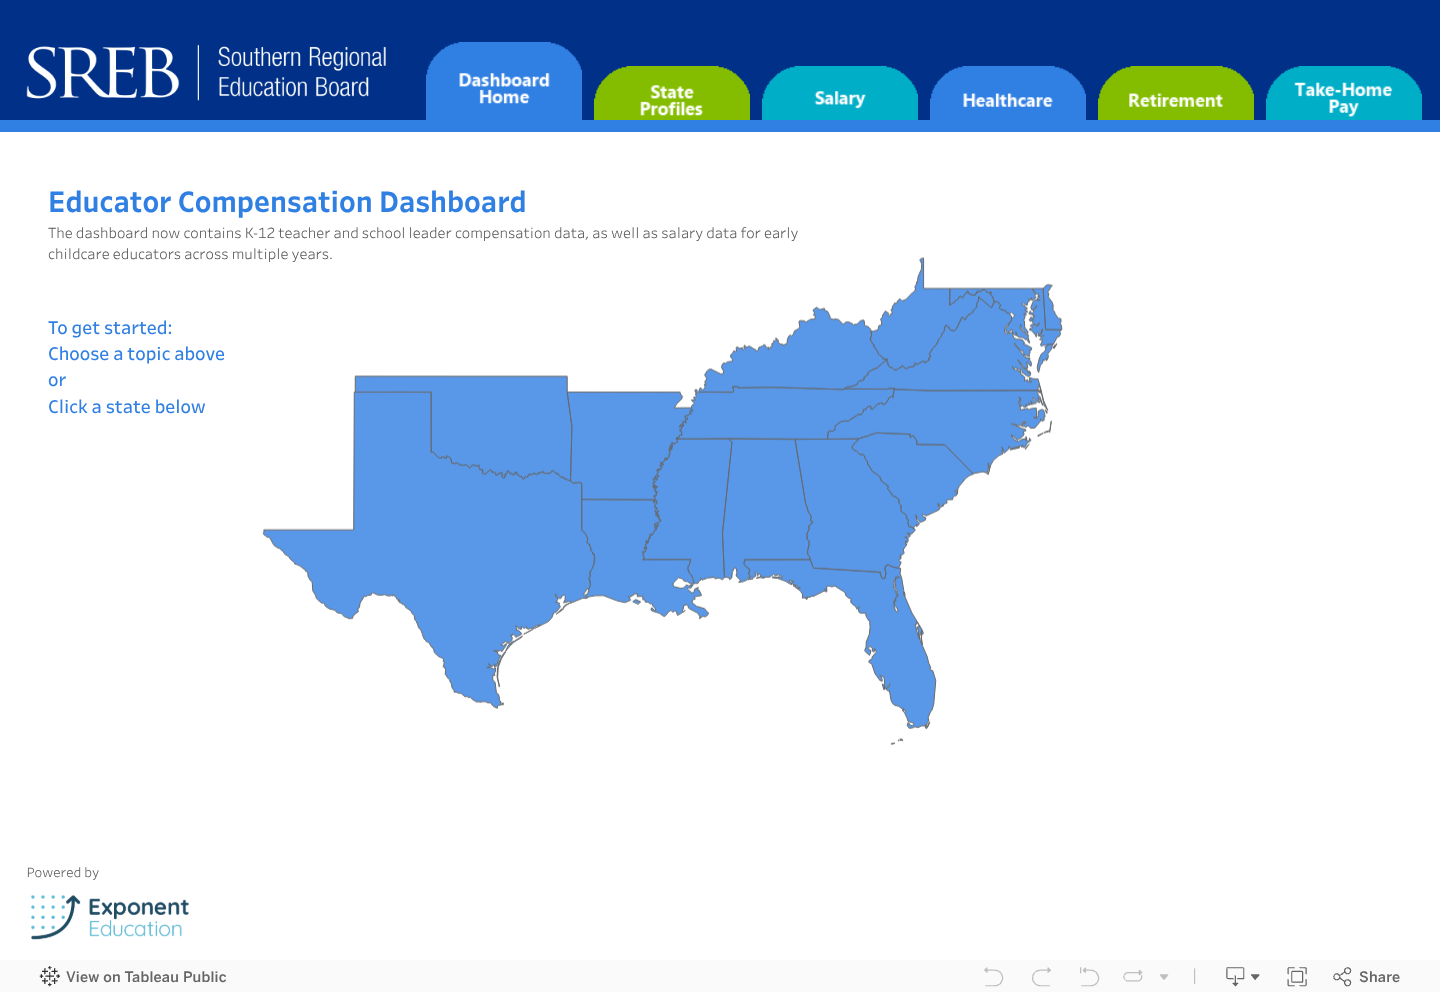
Educator Compensation Dashboard
State & Sample District Data

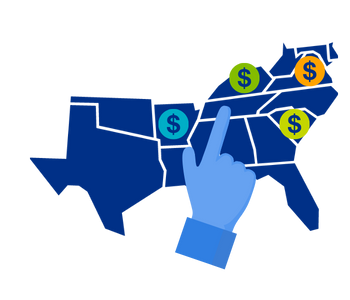 The newly revised Educator Compensation Dashboard features state-by-state annual data for the South on average compensation packages to teachers and leaders, including salaries, retirement benefits, health benefit options and calculations on typical take-home pay for teachers. The dashboard now also contains salary information for early childcare workers.
Our most recent update features state data from the 2023-24 school year.
*Note: These dashboards are best viewed on a computer.
Also available:
Takeaways and Highlights on Educator Compensation
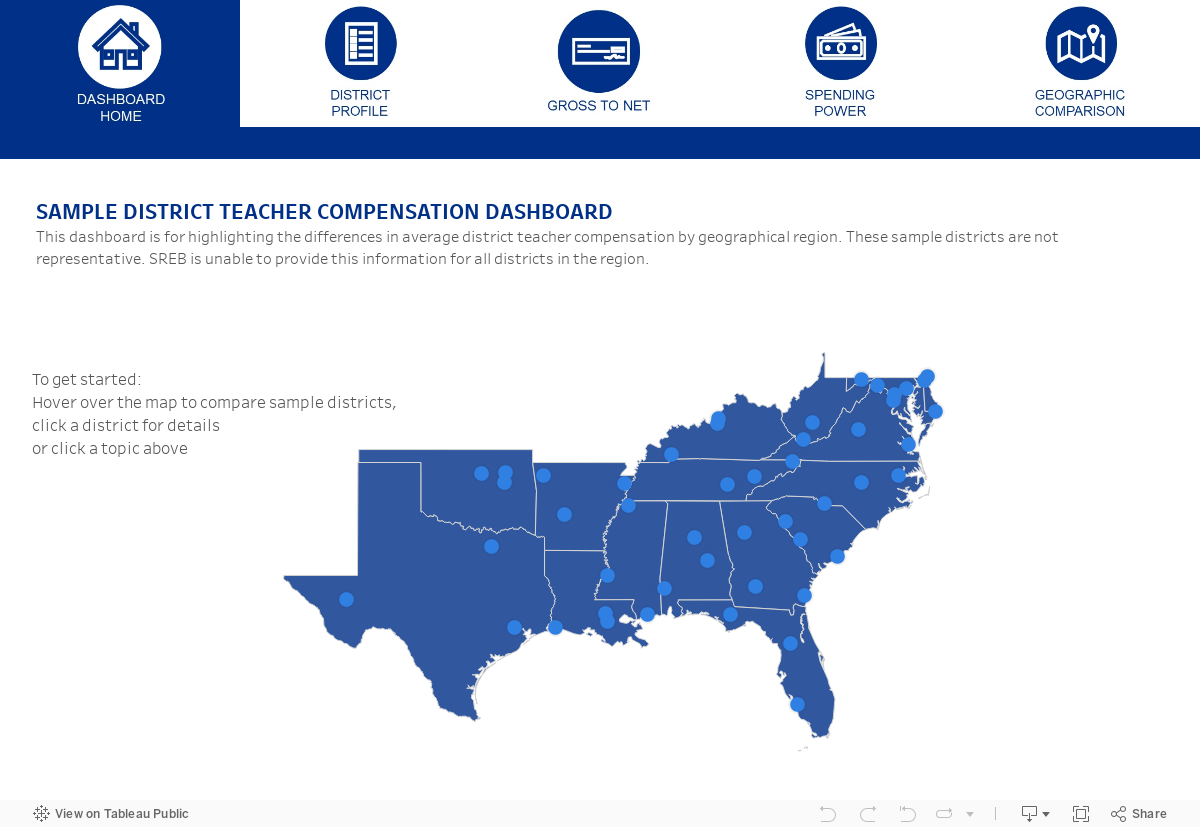
To show how local teacher compensation varies across districts, SREB’s district dashboard includes data from a non-representative sample of 48 rural, suburban and urban school districts across the 16 SREB states to look at teachers’ take-home pay and spending power in different contexts. This data is from the 2022-23 school year.
DOWNLOAD DASHBOARD DATA AS SPREADSHEET
Read More
- Teacher Compensation Calculator – Education Resource Strategies
- “50-State Scan: Teacher Recruitment and Retention 2025″ – Teacher Compensation and Financial Incentives Section, Education Commission of States
- “Do Smarter Teachers Make Smarter Students?” – Eric Hanushek, Marc Piopiunik, and Simon Wiederhold, Education Next
- “Raising public school teacher pay: What the research says” – Denise-Marie Ordway, Journalist’s Resource
- “Your State’s Teachers Are Underpaid. Find Out By How Much” – Alvin Chang, Vox
- “Affordable Benefits are Key to High-Quality Teacher Compensation” – Guest Blogger Megan Boren, Education Commission of the States
- “How Much Does Teacher Health Insurance Cost?” – Chad Aldeman, Teacherpensions.org
- “Healthcare for Life” – Chad Aldeman, EdSource.org
- “How Are School Districts Dealing with Rising Health Insurance Costs?” – N. Gerber, National Council on Teacher Quality
- Comparing Defined Benefit and Defined Contribution Plans: Example from the Florida Retirement System: https://www.myfrs.com/pdf/forms/BCS.pdf
- “4 Ways State Leaders Can Lower Teacher Pension Costs” – Guest Blogger, Chad Aldeman, Education Commission of the States
- “Social Security, Teacher Pensions, and the “Qualified” Retirement Plan Test” – Chad Aldeman, Bellwether Education Partners
- “Teacher Pension Plans: How They Work, and How They Affect Recruitment, Retention, and Equity” – Chad Aldeman, Bellwether Education Partners
Early Childhood & K-12 Educator Salary Footnotes
Average salaries for early childcare educators, plus K-12 teachers and leaders and state K-12 teacher salary schedules are featured from 2013 on.
Definitions and Sources
Cost of Living Index (%): The average annual cost of living index percentage by state, assuming the national COLI is 100%. It is the cost of achieving a certain level of utility (or standard of living) in one year relative to the cost of achieving the same level the next year. Sourced from the Council for Community and Economic Research. COLIs are listed from 2016 on.
Teacher Wage Penalty (%): How much less, in percentage terms, public school teachers are paid in weekly wages relative to other college-educated workers (after accounting for factors known to affect earnings such as education, experience and state residence). Sourced from Economic Policy Institute reports:
- The Teacher Pay Penalty Reached a Record High in 2024. September 2025.
- Teacher Pay Rises In 2023—But Not Enough to Shrink Pay Gap with Other College Graduates. September 2024.
- The Teacher Pay Penalty Still Looms Large. September 2023.
- The Teacher Pay Penalty Has Hit a New High: Trends in Teacher Wages and Compensation Through 2021. August 2022.
- Teacher Pay Penalty Dips but Persists in 2019. September 2020.
- The Teacher Weekly Wage Penalty Hit 21.4 Percent in 2018, a Record High. April 2019.
- The Teacher Pay Penalty Has Hit a New High: Trends in the Teacher Wage and Compensation Gaps Through 2017. September 2018.
- The Teacher Pay Gap Is Wider Than Ever: Teachers’ Pay Continues to Fall Further Behind Pay of Comparable Workers. August 2016.
All Teacher Salary Averages: 2013-2014 school year on. Sourced from National Education Association reports (for available corresponding years) Rankings of the States and Estimates of School Statistics and Teacher Salary Benchmark Report.
Minimum 0-Yr, 15-Yr, 35-Yr Salary Base: Based on SREB review of state minimum teacher salary schedules from state websites for teachers with bachelor’s and master’s degrees. All figures from the corresponding school years, with the exception of the Delaware 2018-19 school year which uses figures from the 2019-20 school year. Figures do not include any state or local supplements or additions for higher degree attainment. Florida, Louisiana, Maryland and Virginia do not have teacher salary schedules. Minimum starting salaries for these states reflect the lowest full-time public school teacher salary paid in a district within the state, when data is available.
Time to Max Salary: The number of years it will take a teacher to reach the maximum salary available on the statewide teacher salary schedule, per degree label. These figures do not include state bonuses or local supplements.
Time to Reach $50,000: The least number of years it will take a teacher to reach a $50k salary based on the state minimum salary schedule, not including state bonuses or local supplements.
Average Wage of Early Head Start and Head Start Teachers: 2021-2022 through 2023-2024 years. Sourced from the Center for American Progress’s Data on Child Care and Early Learning in the United States.
Average Principal Pay: 2021-2022 through 2023-2024 years. Sourced from the Bureau of Labor Statistics.
K-12 Educator Health Benefits Footnotes
All health insurance information displayed represents state-based options only for each school year or fiscal year (identical in most states) from 2019 on. Because most states do not display archived health insurance information, data prior to 2019-20 was not included in this dashboard as it was not available during our baseline year collection timeframe for all states. All plan information was retrieved through state-specific benefit websites.
Definitions
Premiums (Individual and Family): The amount paid monthly for health insurance. Premiums listed for both individual and family coverage are the maximum amount paid by employees.
Deductibles (Individual and Family): The amount you pay for covered health care services before the insurance plan starts to pay.
Out-of-Pocket Maximums (Individual and Family): The most you must pay for covered services in a plan year. This includes deductibles, copayments and coinsurance for in-network care and services.
Individual State Notes and Sources
Alabama: Teacher’s Retirement System (Retirement Systems of Alabama
Arkansas: Health Advantage Arkansas State and Public-School Employees
Delaware: Delaware Department of Human Resources
Florida: Florida Department of Management Services. In addition to the statewide benefits displayed in the dashboard, Florida provides additional plans through other health insurance providers that are district-specific.
Georgia: Georgia State Health Benefit Plan. In addition to the statewide benefits displayed, some Georgia districts provide additional plans through other health insurance providers. These locally based plans are not displayed.
Kentucky: Kentucky Employees’ Health Plan. Kentucky’s premium rates were decided by a formula in 2019-20: Plan Option Cost + Tobacco Usage + Living Well Promise + Time Specific Adjustments. In 2020-21 and beyond, the rate formula was discontinued, and a standard premium amount was instituted for state plans. With this restructuring, Kentucky greatly lowered the premium cost for all state plans.
Louisiana: State of Louisiana Office of Group Benefits
Maryland: The state does not provide an option for educator health insurance. Instead, health insurance is provided at the district level and therefore is not represented in this dashboard. Examples of district benefits are recorded in the new dashboard: Example District Average Teacher Net Pay and Local Economic Data by Urbanicity.
Mississippi: Mississippi Department of Finance and Administration. Mississippi’s premium rate is for Horizon Employees hired after Jan. 1, 2006.
North Carolina: North Carolina State Health Plan. North Carolina’s premium rate is for those with completed tobacco attestation.
Oklahoma: Oklahoma Office of Management and Enterprise Services — Group Insurance Division. Premium costs are deducted by the amount the state contributes to each plan, which in 2019-22 was equal to single coverage premiums from the HealthChoice High plan.
South Carolina: South Carolina Department of Education
Tennessee: Tennessee Partners for Health. Tennessee’s premium rates only encompass the approximately 45% state subsidy found in the healthcare documentation.
Texas: Teacher Retirement System of Texas. The state has moved to a region-based health care plan benefit cost structure. The state was divided into 20 regions in 2023 and each region has an adjusted premium, deductible and out of pocket cost differentiation. SREB averaged the figures across the state to reach the sums provided in the health benefits section for 2023. See this webpage for exact figures in each of the 20 regions.
Virginia: Virginia Department of Human Resource Management
West Virginia: West Virginia Public Employees Insurance Agency. West Virginia’s deductibles and out-of-pocket maximums vary by salary for three of their plans.
K-12 Educator Retirement Benefits Footnotes
All retirement plan figures are for the corresponding fiscal years (in most states identical to the school years) from 2018 on. Plans identified with tier levels are defined benefit plans.
Definitions and Sources
Defined Benefit (DB): A pension plan that is designed to provide participants with a predefined, predictable and guaranteed benefit based on a formula that takes into account an employee’s compensation, years of service and age, or a combination thereof. Many states have instituted tiered levels with plan changes based on year hired.
Defined Contribution (DC): Plans such as 401(k), 403(b) or 457(b) in which retirement savings grow through contribution amounts and investment strategy. The retirement benefit is not pre-determined and is entirely dependent upon the account balance at retirement.
State Pension Benefit Formulas: Multiplier percentage set by the state, multiplied by the average final salary calculation, multiplied by years of service. Sourced from state retirement system handbooks.
Social Security: Social Security originally only covered private workers, but in the 1950s, Congress allowed states to extend coverage to their workers. Some states opted out of enrolling their workers and instead relied on pension plan payout formulas. About 40% of public-school teachers (more than 1 million) are not covered by Social Security according to Bellwether Education Partners.
Vesting Period: A federally mandated minimum period before a retirement plan is unconditionally owned by an employee.
Employee Contribution (%): Percentage contribution amounts mandated by each system. Employee contribution (%) is sourced from state retirement system handbooks.
Employer Contribution (%): The actuarial percentage contribution required by state and district funds; percentages sourced from state retirement system valuation or actuarial reports.
Employer Normal Cost Rate (%): The amount of an employer’s contribution that goes toward a teacher’s retirement benefit, as opposed to paying for unfunded liabilities. Sourced from state retirement system financial reports.
Total Contribution to Teacher Benefit (%): The total contribution amount that goes directly to a teacher’s retirement benefit, which is calculated by adding the Employee Contribution + the Employer Normal Cost Rate.
Contribution to Unfunded Liabilities (%): The amount from an employer’s contribution that is used for paying down unfunded liabilities (as opposed to contributing directly to a teacher’s retirement benefit). Sourced from state retirement system financial reports and handbooks.
Full Retirement Status: Reflects eligibility to retire with full benefits. All states offer an early retirement option with partial benefits. Retirement status in any state is still subject to federal IRS regulation. Sourced from state retirement system handbooks.
Typical Gross Annual Pension Benefit: What the average teacher retiree may gross annually in retirement income. Net benefits and social security benefits are not calculated. This calculation provides a potential typical gross annual pension benefit in each year by state retirement tier. This calculation is not provided for defined contribution or hybrid plans due to the vast number of variables in investments and returns.
Years to Break Even and Percentage of Teachers Who Will Not Break Even (2018-19 sheets only): The number of years it will take a teacher in each plan to earn a pension worth more than their own contributions plus interest and the percent of teachers in the state who will not exceed this point. This analysis does not apply to defined contribution or hybrid plans. Sourced from an analysis by Aldeman and Johnson: https://www.teacherpensions.org/sites/default/files/TeacherPensions_Negative%20Returns_Final.pdf
SREB Assumptions for Typical Gross Annual Pension Benefit:
- The calculations utilize the state plan’s benefit formula which is usually a multiplier, times average of highest pay over a certain number of years, times total years of service. For all calculations, teacher retirees were assumed to be aged 65 with 30 years of service – the common age and service requirement across the region to receive full pension benefits.
- SREB calculated the highest average pay over a certain number of years by: 1) assuming the state’s average top salary as the highest salary amount, 2) calculating the additional highest years of salary by reducing the average top salary amount by the regional average step increase amount linked to years of service that most states utilize in their teacher salary schedule, and 3) averaging these salary amounts for the number of years required in each state’s pension benefit formula.
Individual State Source Links and Notes
Alabama plans (https://www.rsa-al.gov/trs) are based on year hired. Tier I: teachers hired before 2013; Tier II: teachers hired in or after 2013. As of Oct. 1, 2021, the employee contribution for Tier II was raised 0.2% by the state legislature. Employer normal cost rate updates have been incorporated for all years as of fall 2023.
Arkansas (https://www.artrs.gov) has one defined benefit plan for teachers. Unlike most state plans, Arkansas adjusts the employee contribution amount annually.
Delaware (https://open.omb.delaware.gov/) Tier I: teachers hired before 2012; Tier II: teachers hired in or after 2012.
Florida (https://www.myfrs.com) Tier I: teachers hired before July 1, 2011. The pension formula is calculated by a range multiplier based on age and years of service (age 62 or 30 years 1.60%; age 63 or 31 years 1.63%; age 64 or 32 years 1.65%; age 65 or 33 years 1.68%). Tier II: hired on or after July 1, 2011. The pension formula range multiplier changes (age 65 or 33 years 1.60%; age 66 or 34 years 1.63%; age 67 or 35 years 1.65%; age 68 or 36 years 1.68%). New teachers are automatically enrolled in the Investment (DC) plan but can opt to switch to the defined benefit plan at any time. Current teachers hired before July 1, 2011, with five years of service and those hired on or after July 1, 2011, with eight years of service can also opt into a hybrid option within the Investment plan to include partial pension benefits. When a teacher elects this option, the current pension benefit is frozen, and all future contributions are directed to the investment plan.
Georgia: (https://www.trsga.com/) Defined Benefit Legacy: teachers hired before 2009; GSEPS Georgia State Employees Pension and Savings plan: teachers hired in or after 2009.
Kentucky (https://trs.ky.gov/) TRS I: hired prior to July 1, 2002; TRS II: between July 2002-2008; TRS III: between July 1, 2008, and Dec. 31, 2021; TRS IV applies to teachers hired on or after Jan. 1, 2022. The pension formula in Tier III is calculated by a range multiplier based on a scale of years of service for those hired after 2008. Ranges include 1-10 years (1.7); 10.01-20 (2); 20.01-26 (2.3); 26.01-30 (2.5); and 30+ (3). The pension benefit formula for Tier IV is based on two factors: age factor, which is 1.7% from age 57 to 60 and then increases monthly to 1.9% at age 65; and career factor, which is 0.25% from 20 to 29.99 years of service or 0.5% at 30 or more years of service.
Louisiana (https://www.trsl.org/) Tier I: system member before July 1, 1999. Those who retire later (age 65+ or 30+ years of service) are incentivized with a 2.5% benefit multiplier. Tier II: system member between July 1, 1999, and Dec. 31, 2010; Tier III: system member between 2011 and June 30, 2015; Tier IV: system member from July 1, 2015 on.
Maryland (https://sra.maryland.gov/) has two tiers, including the Alternate Contributory Pension Selection plan for teachers hired before July 1, 2011, and the Reformed Contributory Pension Benefit plan for those hired on or after July 1, 2011. Teachers may opt into supplemental defined contribution plans — 457, 401(k) and 403(b) options are available — but there is no employer contribution to these options.
Mississippi (https://www.pers.ms.gov/) Tier I: hired before July 1, 2007; Tier II: hired between July 1, 2007, and June 30, 2011; Tier III: hired on or after July 1, 2011.
North Carolina (https://www.myncretirement.com/member-education/teachers-and-state-employees-retirement-system-tsers) has one defined benefit plan for all employees. The state has instituted a contributions-based benefit cap of $100,000 (adjusted annually for inflation) on a teachers’ average final compensation. Employees are permitted to also invest independently in a supplemental NC 401(k) or NC 457 plan (defined contribution) to accrue additional retirement savings.
Oklahoma (https://oklahoma.gov/trs.html) Tier I: hired before July 1, 1992; Tier II: hired between July 1, 1992 and Nov. 1, 2011; Tier III: hired after Nov. 1, 2011. For those in Tier III, the vestment period increases to 7 years only for those hired after Nov. 1, 2017. There is also an optional 403(b) defined contribution plan but offering this is left up to districts.
South Carolina (https://www.peba.sc.gov/) Class 2: hired before July 1, 2012; Class 3: hired on or after July 1, 2012. Teachers can also opt between the defined benefit applicable to their hire date or the defined contribution plan.
Tennessee (https://treasury.tn.gov/Retirement/Retire-Ready-Tennessee/for-Teachers) Teachers hired before 2014 participate in the Legacy DB plan and optional 401(k) with a vestment period of 5 years. Newly hired teachers enroll in the hybrid plan. Tennessee’s hybrid plan includes partial pension and investment savings options. Teachers are automatically vested in the investment plan portion. Employees contribute 2% to the investment and 5% to the pension portion, while the employer contributes 5% to the investment and 4% to the pension portion.
Texas (https://www.trs.texas.gov) has six tiers in its teacher retirement system based on multiple eligibility criteria, including qualifications to be grandfathered, when service began, when vested, and active status. See this handbook for details: https://www.trs.texas.gov/TRS%20Documents/benefits_handbook.pdf.
Virginia (https://www.varetire.org/) Previously hired teachers had the option of choosing one of two defined benefit plans and could opt into the new hybrid plan. Teachers hired after 2014 enroll in a hybrid pension and investment plan. Virginia’s defined contribution portion of the hybrid plan has a gradual vesting period (50% vested after 2 years, 75% vested after 3 years, fully vested after 4 years). Employees contribute between 1 to 5%, to the investment portion and 5% to the pension portion. The employer contributes between 1 to 3.5% to the investment portion and 15.68% to the pension portion. An optional 457 Deferred Compensation plan is also available to teachers.
West Virginia (https://www.wvretirement.com/TRS.html) Tier I: teachers hired before July 2015; Tier II: teachers hired after July 1, 2015. Teachers in Tier I who were members of the state retirement plan before July 1, 1991, receive 15% employer contributions. West Virginia had a defined contribution plan option between 1991 and 2005 when it was closed to new membership; it is not an option for new teachers to participate in this plan currently. For those who opted into this plan prior to 2005, the plan had a gradual vesting period of (1/3 vested at 6 years, 2/3 vested at 9 years, and fully vested at 12 years).
K-12 Educator Take Home Pay Footnotes
Typical Take Home Pay: What the average first-year teacher, mid-career or 15th year teacher, 35th year teacher and principal brings home in their paycheck after deducting their required retirement contribution, their health insurance premium costs and taxes, as calculated by SREB. Calculations do NOT include extra deductions for additional health benefits, FSA or HSA options, etc., additional retirement savings by employees, nor additional tax withholdings. Net pay calculations are not provided for early childcare workers due to the variance in benefits packages across early learning facility types.
Note: Maryland does not provide an option for educator health insurance. Instead, health insurance is provided at the district level and therefore is not represented in Maryland’s take home pay calculation.
SREB Calculation Assumptions for 2019 Take Home Pay
- Tax Calculations: July 1, 2019, date used for calculation of federal and state taxes using ADP.com with applicable marital status and one allowance.
- Typical 1st year teacher: Hired in 2018. Average state starting bachelor’s salary. Single w/ no dependents. Selects HMO plan for employee only. Eligible for newest pension plan tier or investment/hybrid plan option.
- Typical 15th year teacher: Hired in 2004. Average state salary. Married with two children, spouse is employed. Selects family PPO plan. Eligible for pension plan tier applicable to hire date.
- Typical 35th year teacher: Hired in 1984. Average state top salary. Married with two children under age 26; employed spouse. Selects family PPO plan. Eligible for pension plan tier applicable to hire date.
SREB Calculation Assumptions for 2020 Take Home Pay
- Tax calculations: June 1, 2020, date used for calculation of federal and state taxes using ADP.com with applicable marital status and one allowance.
- Typical 1st year teacher: Hired in 2019. Average state starting bachelor’s salary. Single w/ no dependents. Selects HMO plan for employee only. Eligible for newest pension plan tier or investment/hybrid plan option.
- Typical 15th year teacher: Hired in 2005. Average state salary. Married with two children, spouse is employed. Selects family PPO plan. Eligible for pension plan tier applicable to hire date.
- Typical 35th year teacher: Hired in 1985. Average state top salary. Married with two children under age 26; employed spouse. Selects family PPO plan. Eligible for pension plan tier applicable to hire date.
SREB Calculations for 2021 Take Home Pay
- Tax calculations: June 1, 2021, date used for calculation of federal and state taxes using ADP.com with applicable marital status and one allowance.
- Typical 1st year teacher: Hired in 2020. Average state starting bachelor’s salary. Single w/ no dependents. Selects HMO plan for employee only. Eligible for newest pension plan tier or investment/hybrid plan option.
- Typical 15th year teacher: Hired in 2006. Average state salary. Married with two children, spouse is employed. Selects family PPO plan. Eligible for pension plan tier applicable to hire date.
- Typical 35th year teacher: Hired in 1986. Average state top salary. Married with two children under age 26; employed spouse. Selects family PPO plan. Eligible for pension plan tier applicable to hire date.
- OF NOTE: Kentucky’s dramatic increase in take-home pay for each teacher experience level for 2020 is mostly attributed to the restructuring and reduced cost of state health premiums for all state plans.
SREB Calculations for 2022 Take Home Pay
- Tax calculations: June 1, 2022, date used for calculation of federal and state taxes using ADP.com with applicable marital status and one allowance.
- Typical 1st year teacher: Hired in 2021. Average state starting bachelor’s salary. Single w/ no dependents. Selects HMO plan for employee only. Eligible for newest pension plan tier or investment/hybrid plan option.
- Typical 15th year teacher: Hired in 2007. Average state salary. Married with two children, spouse is employed. Selects family PPO plan. Eligible for pension plan tier applicable to hire date.
- Typical 35th year teacher: Hired in 1987. Average state top salary. Married with two children under age 26; employed spouse. Selects family PPO plan. Eligible for pension plan tier applicable to hire date.
- Typical Principal: Hired in 2007. Average K-12 educational administrator salary. Married with two children under age 26; employed spouse. Selects family PPO plan. Eligible for pension plan tier applicable to hire date.
SREB Calculations for 2023 Take Home Pay
- Tax calculations: June 1, 2023, date used for calculation of federal and state taxes using ADP.com with applicable marital status and one allowance.
- Typical 1st year teacher: Hired in 2022. Average state starting bachelor’s salary. Single w/ no dependents. Selects HMO plan for employee only. Eligible for newest pension plan tier or investment/hybrid plan option.
- Typical 15th year teacher: Hired in 2008. Average state salary. Married with two children, spouse is employed. Selects family PPO plan. Eligible for pension plan tier applicable to hire date.
- Typical 35th year teacher: Hired in 1988. Average state top salary. Married with two children under age 26; employed spouse. Selects family PPO plan. Eligible for pension plan tier applicable to hire date.
- Typical Principal: Hired in 2008. Average K-12 educational administrator salary. Married with two children under age 26; employed spouse. Selects family PPO plan. Eligible for pension plan tier applicable to hire date.
- OF NOTE: Texas healthcare premium costs are based on averaging the costs in all 20 benefit regions established in 2021. See the 2023 health benefits section footnotes for more information.
SREB Calculations for 2024 Take Home Pay
- Tax calculations: June 1, 2024, date used for calculation of federal and state taxes using ADP.com with applicable marital status and one allowance.
- Typical 1st year teacher: Hired in 2023. Average state starting bachelor’s salary. Single w/ no dependents. Selects HMO plan for employee only. Eligible for newest pension plan tier or investment/hybrid plan option.
- Typical 15th year teacher: Hired in 2009. Average state salary. Married with two children, spouse is employed. Selects family PPO plan. Eligible for pension plan tier applicable to hire date.
- Typical 35th year teacher: Hired in 1989. Average state top salary. Married with two children under age 26; employed spouse. Selects family PPO plan. Eligible for pension plan tier applicable to hire date.
- Typical Principal: Hired in 2009. Average K-12 educational administrator salary. Married with two children under age 26; employed spouse. Selects family PPO plan. Eligible for pension plan tier applicable to hire date.
- OF NOTE: Texas healthcare premium costs are based on averaging the costs in all 20 benefit regions established in 2021. See the 2024 health benefits section footnotes for more information.
2022-23 Sample District Average Teacher Compensation and Local Economic Data by Geographic Comparison Footnotes
SREB collected sample rural, suburban and urban district teacher compensation data in states to:
- provide users more up-to-date, locally based sample context to teacher compensation and how it varies widely across districts in the South
- calculate a more accurate teacher take home pay in different contexts
- provide local economic and cost of living data, sourced from the Council for Community and Economic Research, to understand how far the average teacher’s paycheck stretches and the financial implications of their compensation packages.
*This tool is for use in comparing samples only and is not representative. SREB is unable to provide this information for all districts in the region. School districts were selected based on population density, transparency and availability of publicly available teacher compensation data, demographic and economic diversity, and in some cases, proximity to bordering states.
To see each example school districts’ details, including a description of the district and their benefit package options for teachers, download the Excel sheet for all notes and data points.
Definitions and Sources
District Average Teacher Net Pay: This shows what the average teacher in the district brings home in their paycheck after deducting their required retirement contribution, their health insurance premium costs and taxes, as calculated by SREB. This calculation uses the district reported average teacher salaries, health care premiums for medical insurance which may or may not reflect differential contribution amounts from the employer, the required employee retirement contribution calculation, and applicable federal and state and applicable local taxes as calculated via ADP.com.
- Assumptions used in calculation of net pay are identical to the assumptions used in the state average take home pay section of the SREB Teacher Compensation Dashboard. Those assumptions are: Hired in 2008. Average state salary. Married with two children, spouse is employed. Selects family PPO plan. Eligible for pension plan tier applicable to hire date. Tax calculations: June 1, 2023, date used for calculation of federal and state taxes using the ADP.com calculator with applicable marital status and one allowance.
County COLI and Median Household Income: The average annual cost of living index percentage by county assuming the national COLI is 100%. Data includes the COLI for Q2 2023 and the median and adjusted median household income by county in the U.S. Sourced from the Council for Community and Economic Research.
Quarterly Index Cost of Living Index for basic living costs (%): This index provides a useful and reasonably accurate measure of living cost differences among metro and micro urban areas, displaying the cost of achieving a certain level of utility (or standard of living) in one quarter relative to the cost of achieving the same level the next quarter. The index measures relative price levels for consumer goods and services in participating areas. The average for all participating places, both metropolitan and nonmetropolitan, equals 100, and each participant’s index is read as a percentage of the average for all places. Sourced from the Council for Community and Economic Research for Q2 of 2023.
District Minimum Salary Schedules: Local district salary schedules denote the minimum pay for certified teachers holding either bachelor’s and master’s degrees during their first year of teaching and their 15th year of teaching. These numbers come from the school district’s publicly available salary schedule files. Compare these district salary schedules to the state minimum salary schedules in the Teacher Compensation Dashboard.
Websites used for this collection, in addition to state websites noted in earlier footnotes for state retirement systems, include:
Alabama websites:
- Note: Data request submitted for average teacher salaries by district in 2022-23 to the Alabama State Department of Education. No data received as of publication. Data sourced from AL.com: https://www.al.com/educationlab/2023/05/alabama-teachers-might-get-a-pay-raise-how-much-do-districts-pay-now.html
- Alabama State Department of Education Report Card https://reportcard.alsde.edu/SelectSchool.aspx
- The Retirement System of Alabama https://www.rsa-al.gov/peehip/publications/
- Washington County Public Schools https://www.wcbek12.org/Page/1
- Elmore County Public Schools https://www.elmoreco.com/
- Birmingham City Schools https://www.bhamcityschools.org/
Arkansas websites:
- Arkansas Department of Education Data Center https://myschoolinfo.arkansas.gov/
- Arkansas Department of Elementary and Secondary Education Annual Statistical Report https://dese.ade.arkansas.gov/Files/Annual_Statistics_Report_w.GL_1_2024_FAS.pdf
- My ARBenefits Public School Employees Plans https://www.healthadvantage-hmo.com/members/employer-coverage/arkansas-state-public-school/pse-plans
- Arkansas Teacher Retirement System https://www.artrs.gov/
- Osceola School District https://www.osd1.org/
- Hot Springs School District https://www.hssd.net/
- Fayetteville School District https://district.fayar.net/
Delaware websites:
- Delaware Report Card https://reportcard.doe.k12.de.us/index.html
- Delaware Open Data https://data.delaware.gov/
- Delaware Department of Human Resources https://dhr.delaware.gov/benefits/education/index.shtml
- State of Delaware Office of Pensions https://delaware.gov/state-directory
- Indian River School District https://www.irsd.net/
- Red Clay Consolidated School District https://www.redclayschools.com/Domain/4
- Christina School District https://www.christinak12.org/Domain/4
Florida websites:
- Florida Department of Education Know Your Data Advanced Reports https://edudata.fldoe.org/AdvancedReports.html
- Florida Retirement Systems https://www.myfrs.com/
- Calhoun County School District http://calhounflschools.org
- Marion County Public Schools https://www.marionschools.net
- Lee County Public Schools https://leeschools.net
Georgia websites:
- Georgia Governor’s Office of Student Achievement Report Card https://gosa.georgia.gov/dashboards-data-report-card/report-card
- State Health Benefit Plan of Georgia https://shbp.georgia.gov/
- Worth County School District https://www.worthschools.net/
- Glynn County School District https://www.glynn.k12.ga.us/
- Atlanta Public Schools https://www.atlantapublicschools.us/
Kentucky websites:
- Kentucky School Report Cards https://www.kyschoolreportcard.com/home?year=2023
- Teachers’ Retirement System Kentucky https://trs.ky.gov/
- Kentucky Employees’ Health Plan (KEHP) https://trs.ky.gov/retired-members/under-age-65/
- Trigg County School District https://www.trigg.kyschools.us/
- Bullitt County School District https://www.bullitt.k12.ky.us/
- Jefferson County Public Schools https://www.jefferson.kyschools.us/
Louisiana websites:
- Louisiana Department of Education Report Cards https://www.louisianabelieves.com/data/
- Louisiana Department of Education Workforce Attributes https://www.louisianabelieves.com/resources/library/workforce-attributes
- Louisiana Office of Group Benefits https://info.groupbenefits.org/
- Teachers’ Retirement System of Louisiana https://www.trsl.org/
- Cameron Parish School District https://www.camsch.org/
- Ascension Parish Public Schools https://www.ascensionschools.org/
- East Baton Rouge Parish Schools https://ebrschools.org/
Maryland websites:
- Maryland State Department of Education Report Cards https://reportcard.msde.maryland.gov/
- Maryland Public Schools Analysis of Professional Salaries https://www.marylandpublicschools.org/about/Documents/DCAA/SSP/20222023Staff/2023AnalysisProfSalaries.pdf
- Maryland Public Schools Professional Salary Schedules https://www.marylandpublicschools.org/about/Documents/DCAA/SSP/20222023Staff/2022-2023_Professional_Salary_Schedules.pdf
- Maryland State Retirement and Pension System https://sra.maryland.gov/
- Allegany County Public Schools https://www.acpsmd.org/Domain/4
- Montgomery County Public Schools https://www2.montgomeryschoolsmd.org/
- Baltimore City Public Schools https://www.baltimorecityschools.org/
Mississippi websites:
- Mississippi Succeeds Report Card https://msrc.mdek12.org/
- Mississippi Department of Education Superintendents Annual Report https://www.mdek12.org/superintendent2023
- Public Employees Retirement System of Mississippi https://www.pers.ms.gov/
- Claiborne County https://www.claiborne.k12.ms.us/Page/1
- Desoto County Schools https://www.desotocountyschools.org/
- Gulfport School District https://www.gulfportschools.org/
North Carolina websites:
- North Carolina School Report Cards https://ncreports.ondemand.sas.com/src/
- Highlights of the North Carolina Public School Budget https://www.dpi.nc.gov/documents/fbs/resources/2023-highlightspdf-0/download?attachment
- North Carolina Average Local Salary Supplement https://public.tableau.com/app/profile/chris.palmer2990/viz/AverageLocalSalarySupplementforK-12TeachersinTraditionalPublicSchoolsbyDistrict2022-23/Sheet1?publish=yes
- North Carolina Teachers’ and State Employees’ Retirement System https://www.myncretirement.com/member-education/teachers-and-state-employees-retirement-system-tsers
- Bertie County Schools: https://www.bertie.k12.nc.us/
- Union County Public Schools: https://www.ucps.k12.nc.us/ucps
- Wake County Public School System: https://www.wcpss.net/wcpss
Oklahoma websites:
- Oklahoma School Report Cards https://oklaschools.com/
- Oklahoma Office of Management and Enterprise Services https://oklahoma.gov/omes/divisions/human-capital-management/employee-benefits.html
- Oklahoma Teachers’ Retirement System https://oklahoma.gov/trs.html
- Preston Public School https://prestonps.com/
- Stillwater Public Schools https://www.stillwaterschools.com/
- Tulsa Public Schools https://www.tulsaschools.org/
South Carolina websites:
- South Carolina Department of Education School Report Card https://ed.sc.gov/data/report-cards/sc-school-report-card/
- South Carolina Retirement Systems and State Health Plan https://www.peba.sc.gov/health
- Abbeville County School District https://www.acsdsc.org/
- Aiken County Public School District https://www.acpsd.net/
- Charleston County School District https://www.ccsdschools.com/
Tennessee websites:
- Tennessee State Report Card https://www.tn.gov/education/families/report-card.html
- Tennessee Department of Education Annual Statistical Report https://www.tn.gov/education/districts/federal-programs-and-oversight/data/department-reports.html
- Tennessee Consolidated Retirement System https://treasury.tn.gov/Retirement/Retire-Ready-Tennessee/Discover-RetireReadyTN
- Bledsoe County School District https://www.bledsoecountyschools.org/
- Bristol Tennessee City Schools https://www.btcs.org/
- Knox County Schools https://www.knoxschools.org
Texas websites:
- Note: Average teacher salary data by district not found on the Texas Education Agency’s website. Data sourced from The Houston Chronicle, linked below: https://www.houstonchronicle.com/news/houston-texas/education/article/houston-texas-district-teacher-salary-data-18196853.php
- Texas Education Agency Snapshot Report https://rptsvr1.tea.texas.gov/perfreport/snapshot/snapshot_srch.html
- Texas Education Agency Accountability Report https://rptsvr1.tea.texas.gov/perfreport/account/acct_srch.html
- Teacher Retirement Service of Texas https://www.trs.texas.gov/Pages/Homepage.aspx; https://www.trs.texas.gov/Pages/healthcare-trsactivecare-2022-23-plans.aspx
- Balmorhea Independent School District https://www.bisdbears.esc18.net/
- McKinney Independent School District https://www.mckinneyisd.net/
- Houston Independent School District https://www.houstonisd.org/
Virginia websites:
- Virginia Department of Education School Quality Profiles https://schoolquality.virginia.gov/
- Virginia Department of Education Superintendent’s Annual Report https://www.doe.virginia.gov/data-policy-funding/data-reports/statistics-reports/superintendent-s-annual-report
- Virginia Department of Education Teacher Salary Report https://www.doe.virginia.gov/home/showpublisheddocument/53111/638449192805673046
- Virginia Retirement System https://www.varetire.org/
- Nelson County Public Schools https://www.nelson.k12.va.us/
- York County School Division https://yorkcountyschools.org/
- Fairfax County Public Schools https://www.fcps.edu/
West Virginia websites:
- West Virginia Department of Education https://zoomwv.k12.wv.us/Dashboard/dashboard/28116
- West Virginia Department of Education School Finance Data https://wvde.us/finance-and-administration/school-finance/data/
- West Virginia Public Employees Insurance Agency Health Plans https://peia.wv.gov/Health-Plans/Pages/default.aspx
- West Virginia Consolidated Public Retirement Board https://www.wvretirement.com/
- McDowell County Schools https://boe.mcdo.k12.wv.us/
- Fayette County Schools https://www.boe.faye.k12.wv.us/
- Berkeley County Schools https://www.berkeleycountyschools.org/