Educator Workforce Data
Educator Workforce Data
To address teacher shortages, elevate the profession, and fuel the economy, a key first step is unpacking the data.
States are uniquely positioned for this work — by collecting, analyzing, and distributing teacher workforce data, states can shine a light on causes and solutions. SREB supports states’ efforts to use P-12 educator workforce data to inform strong policies and practices, shares ongoing research and analysis, and conducts focus groups with teachers across the region to learn more about their experiences.
 SREB partners with the Tennessee Education Research Alliance at Vanderbilt University to produce new research about trends in the teacher labor market, including educator experiences and perceptions, using data from some of our member states.
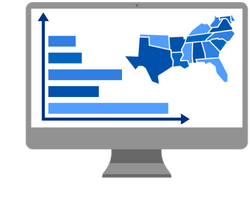 Explore regional highlights, state-by-state data collections, and spotlights of promising state practices from across the South. Data include various measures of early childhood educators and K-12 teacher and leader quantity, preparation, demographics, shortages, quality, and talent distribution from 2019-2024.
Educator Compensation Dashboard
State & Sample District Data
 The newly revised Educator Compensation Dashboard features state-by-state annual data for the South on average compensation packages to teachers and leaders, including salaries, retirement benefits, health benefit options and calculations on typical take-home pay for teachers. The dashboard now also contains salary information for early childcare workers.
Our most recent update features state data from the 2023-24 school year.
*Note: These dashboards are best viewed on a computer.
Also available:
Takeaways and Highlights on Educator Compensation
Building a First-Rate Teacher Workforce
Four Fundamentals of Attracting and Retaining Great Teachers — Starting with Data
 Districts and schools are having to rely on a “warm body” approach to address teacher shortages, focusing on filling numerical vacancies over teacher qualification or preparedness. But taking a closer look at four data categories can make efforts to solve shortages more effective and longer-lasting.