Teacher Shortage Areas
Data on teacher shortages by subject area
Teacher Shortage Areas in the South: Click the options below to explore the data.


Regional Highlights
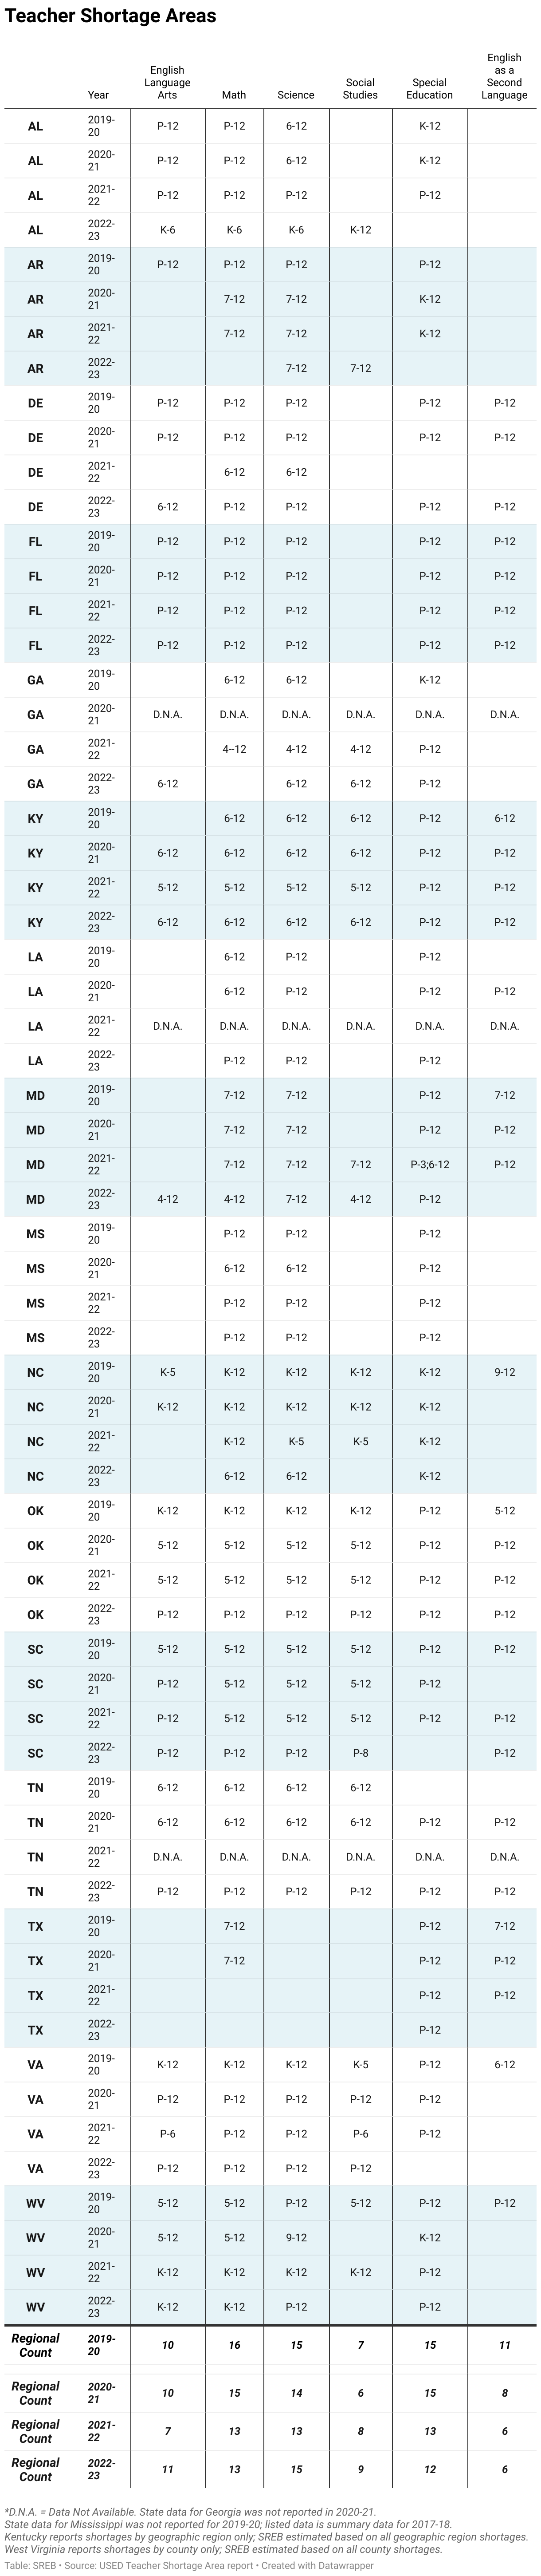
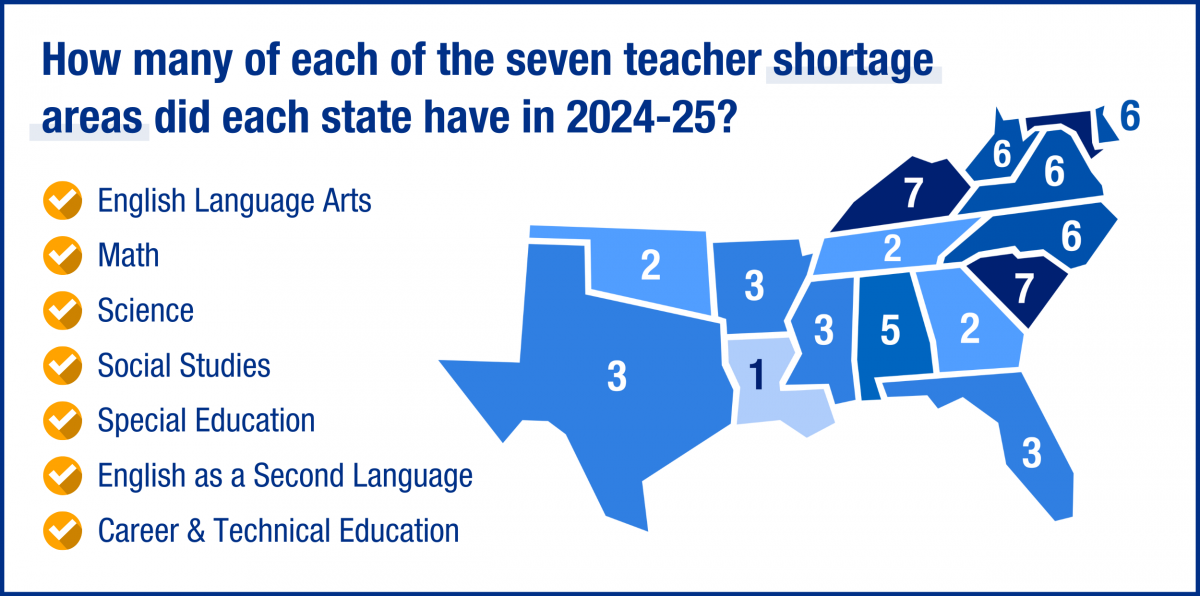
Each year, SREB examines teacher shortages in seven key subject areas — English language arts, math, science, social studies, special education, English as a second language, and career and technical education. Every state in the SREB region has experienced teacher shortages in multiple subject areas over the last six school years (2019-20 to 2024-25).
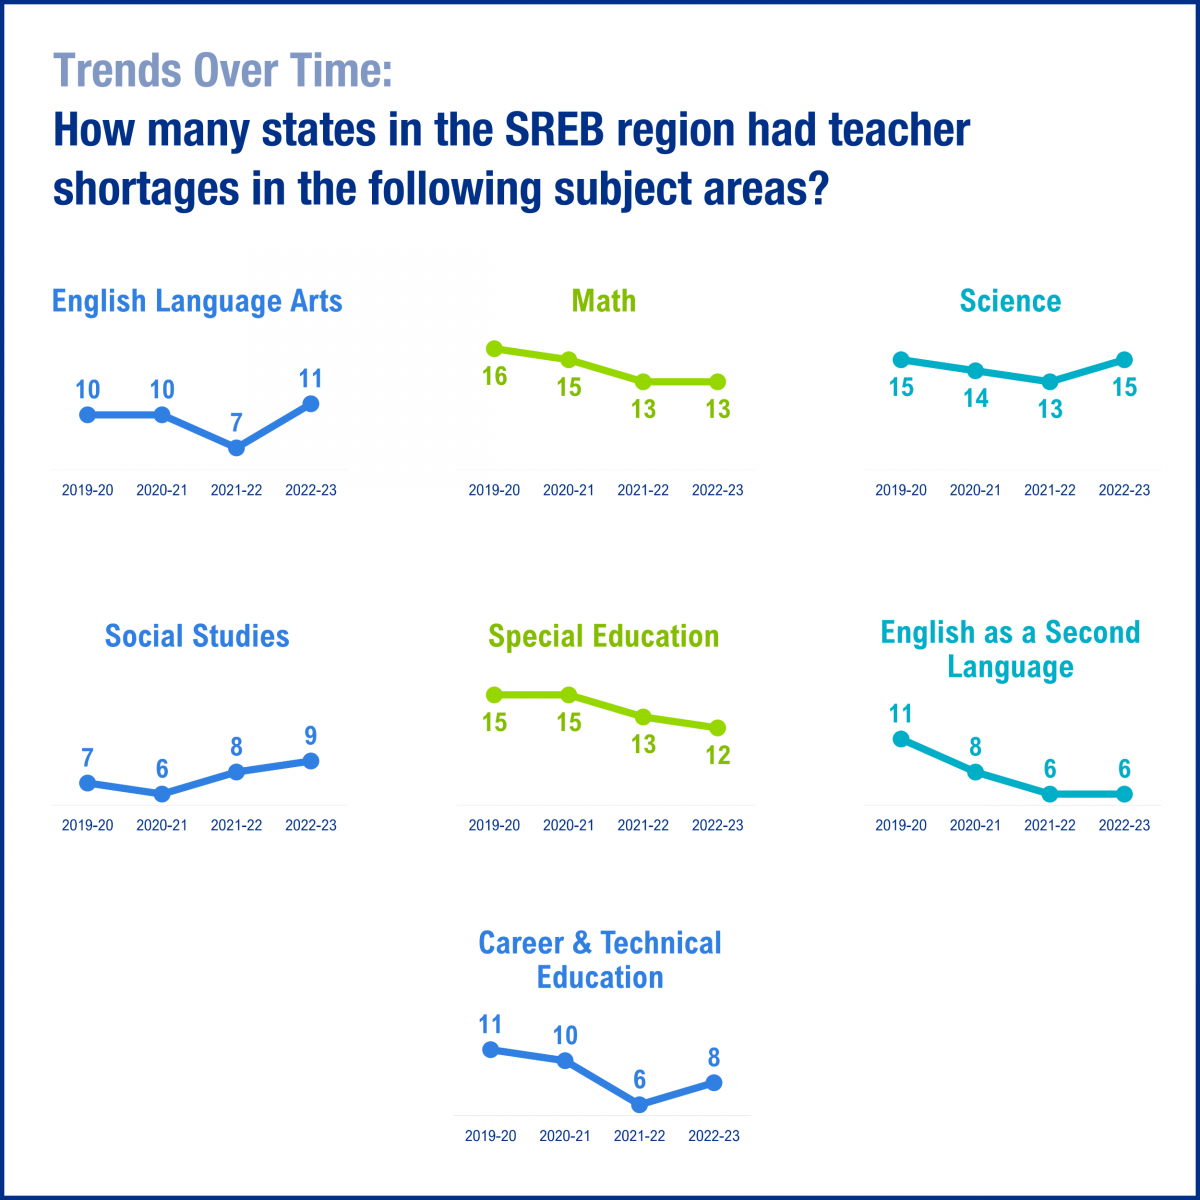
On average across the SREB region, teacher shortages did not become more prevalent in any of the seven key subject areas during the 2024-25 school year. In fact, fewer states experienced shortages in English language arts, math, science, and social studies — and the number of states with shortages in special education, English as a second language, and career and technical education remained steady between 2023-24 and 2024-25.
Among the 16 states in the SREB region, math, science, and special education are the subject areas with the most widespread teacher shortages on average over the last six school years.

Data by State