Teacher Demographics
Data on teacher race, ethnicity, gender and education level

Post

Teacher Demographics in the South: Click the options below to explore the data.

View regional highlightsExplore data by state

Regional Highlights

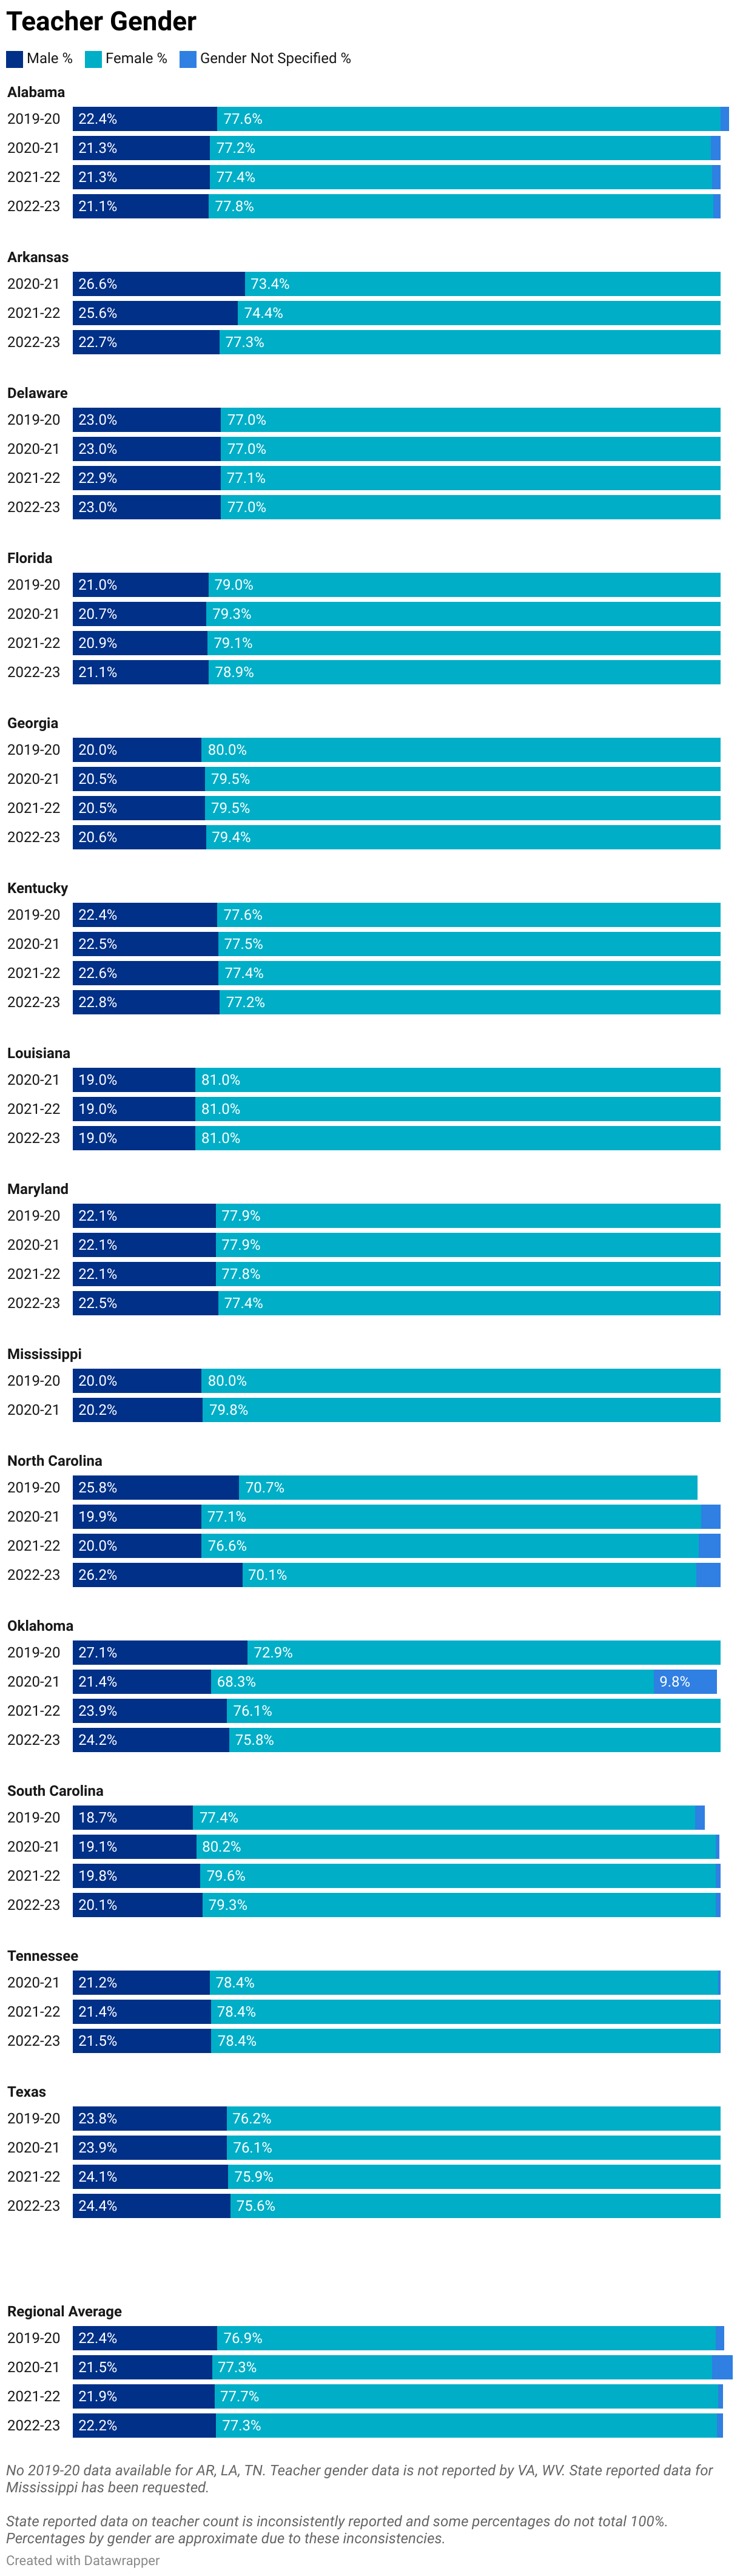
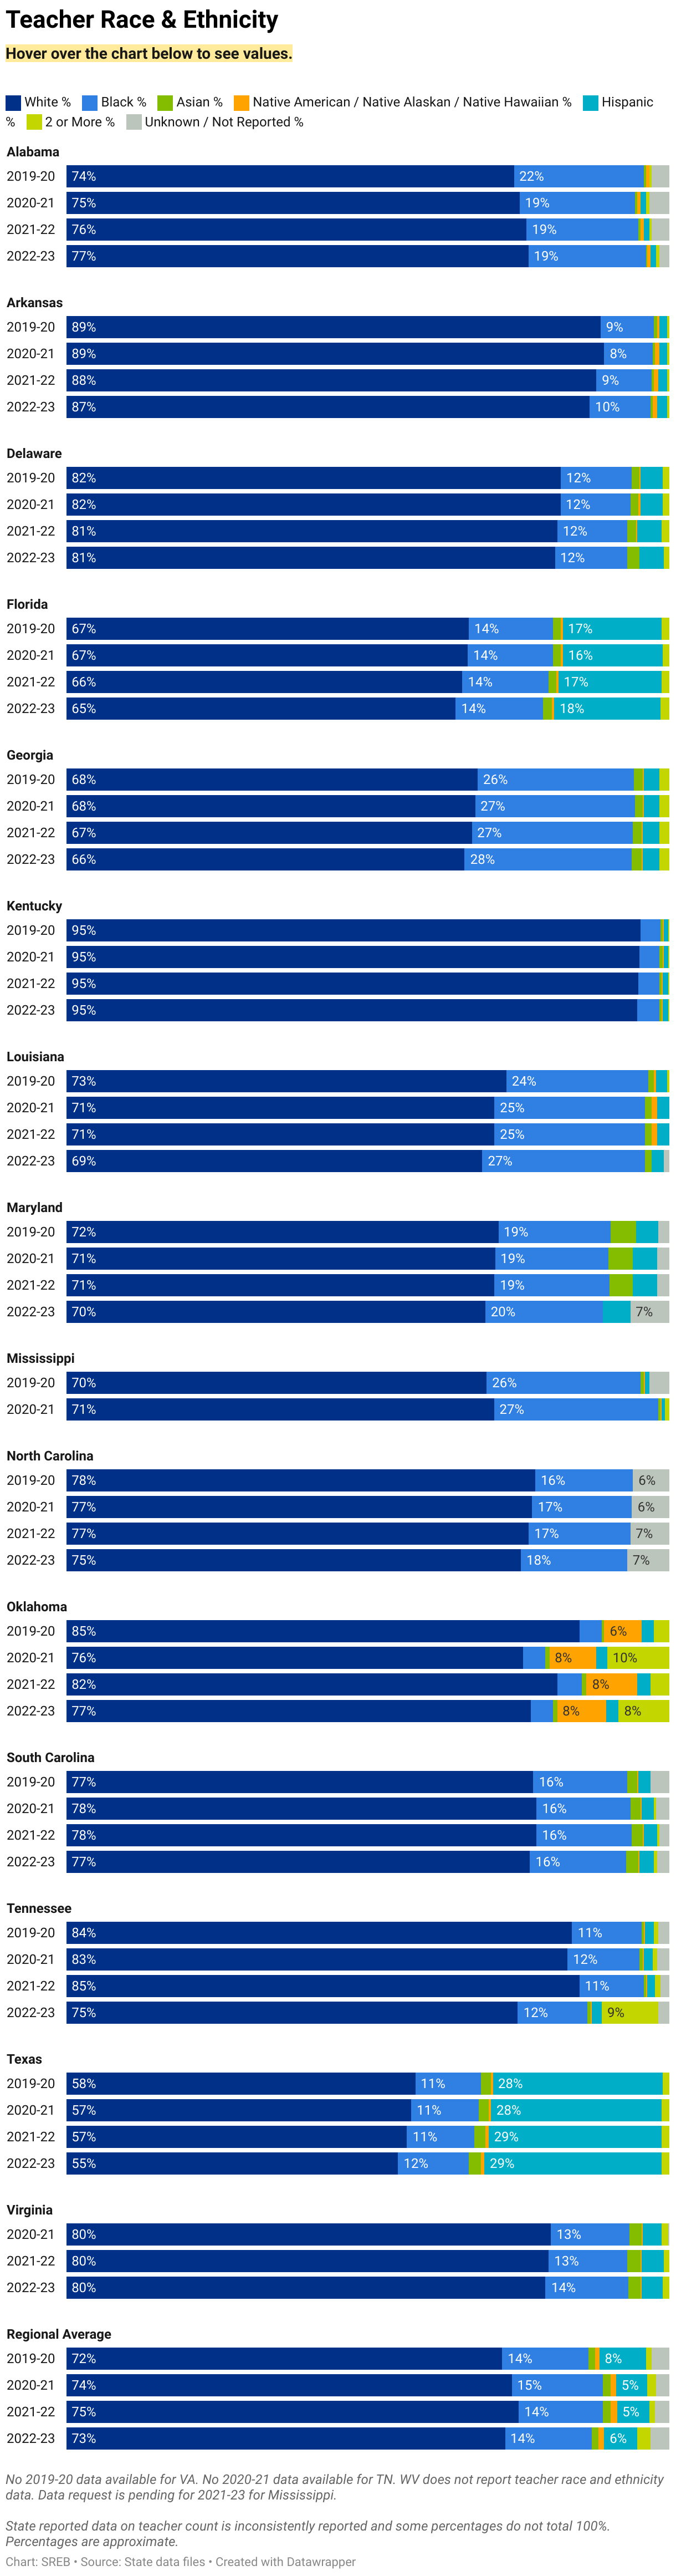
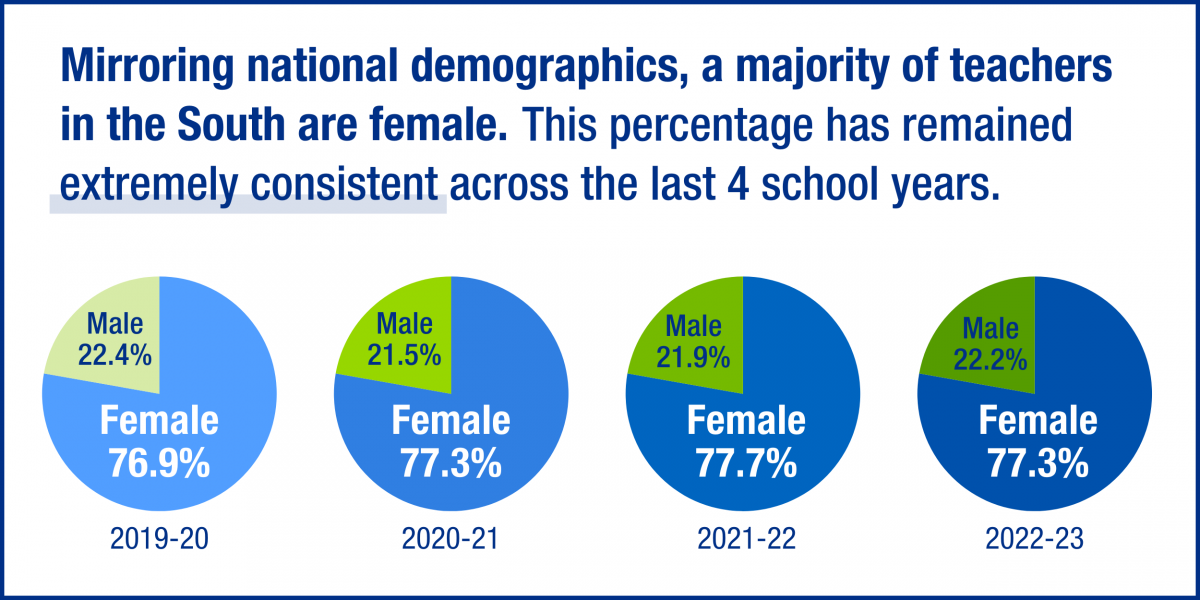
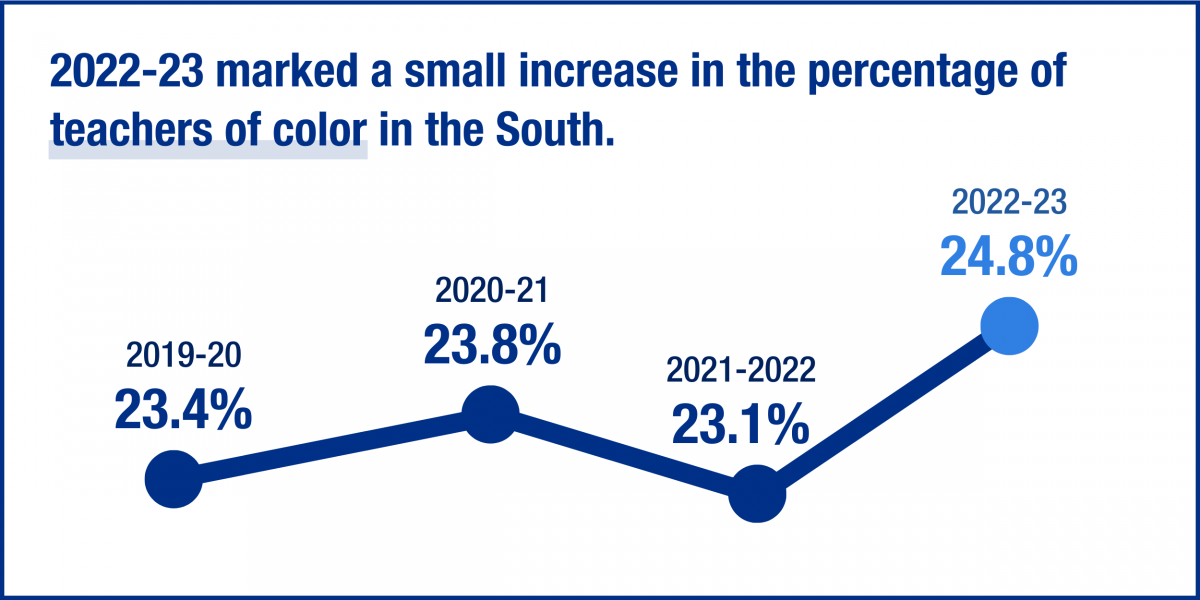
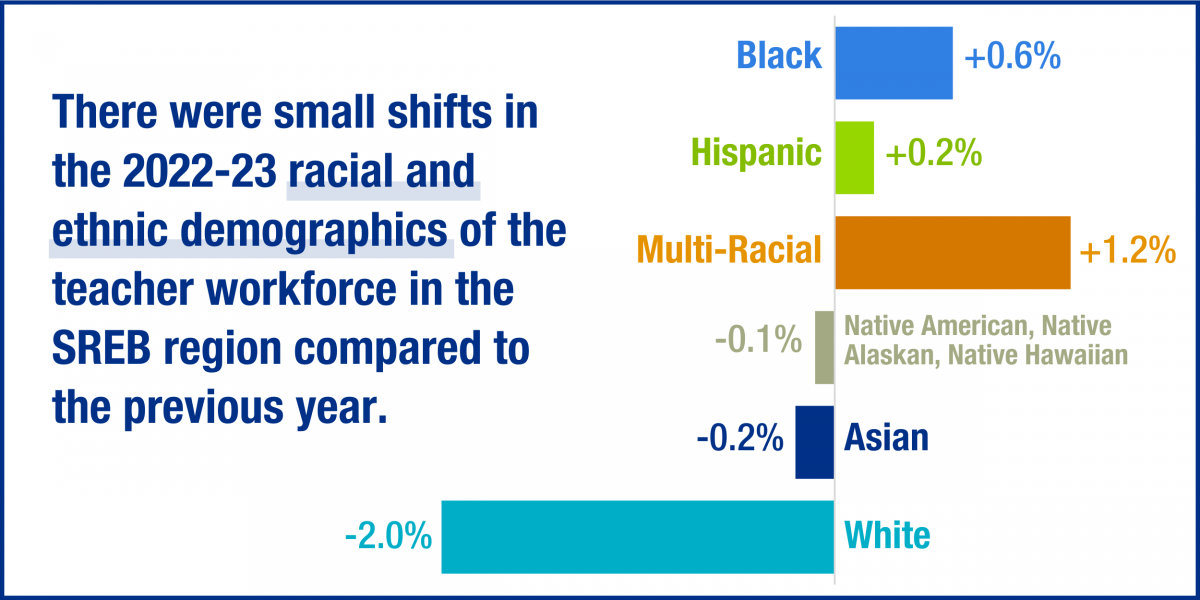
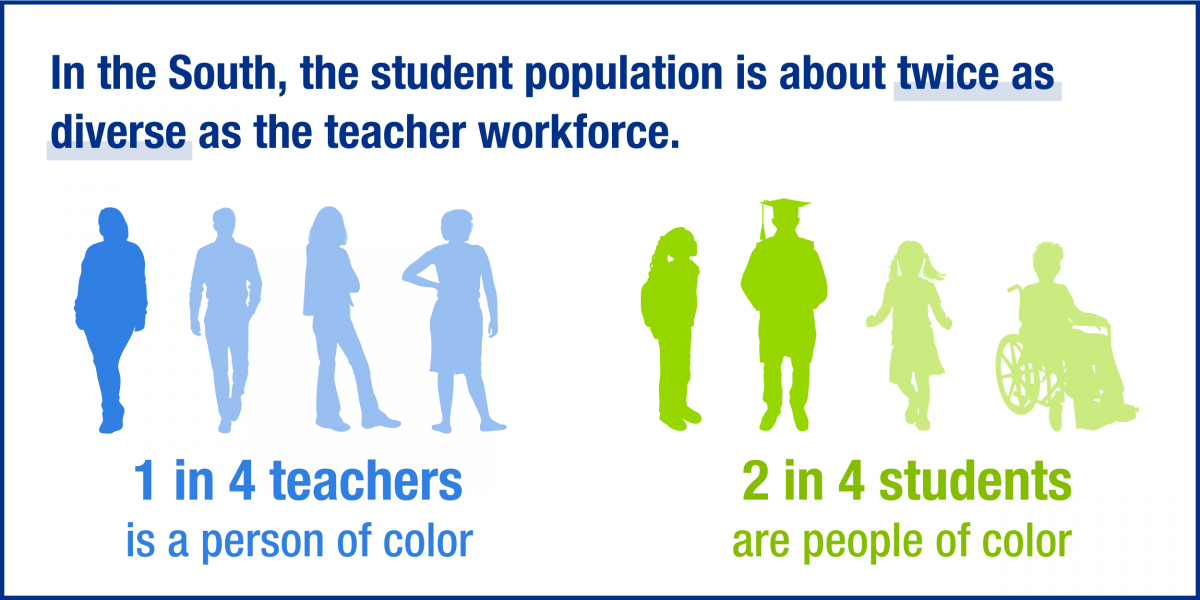
During the 2023-24 school year, the teacher workforce across the SREB region remained predominantly female. Despite becoming slightly more racially and ethnically diverse, the teacher workforce in the South does not reflect the overall diversity of the student population. 

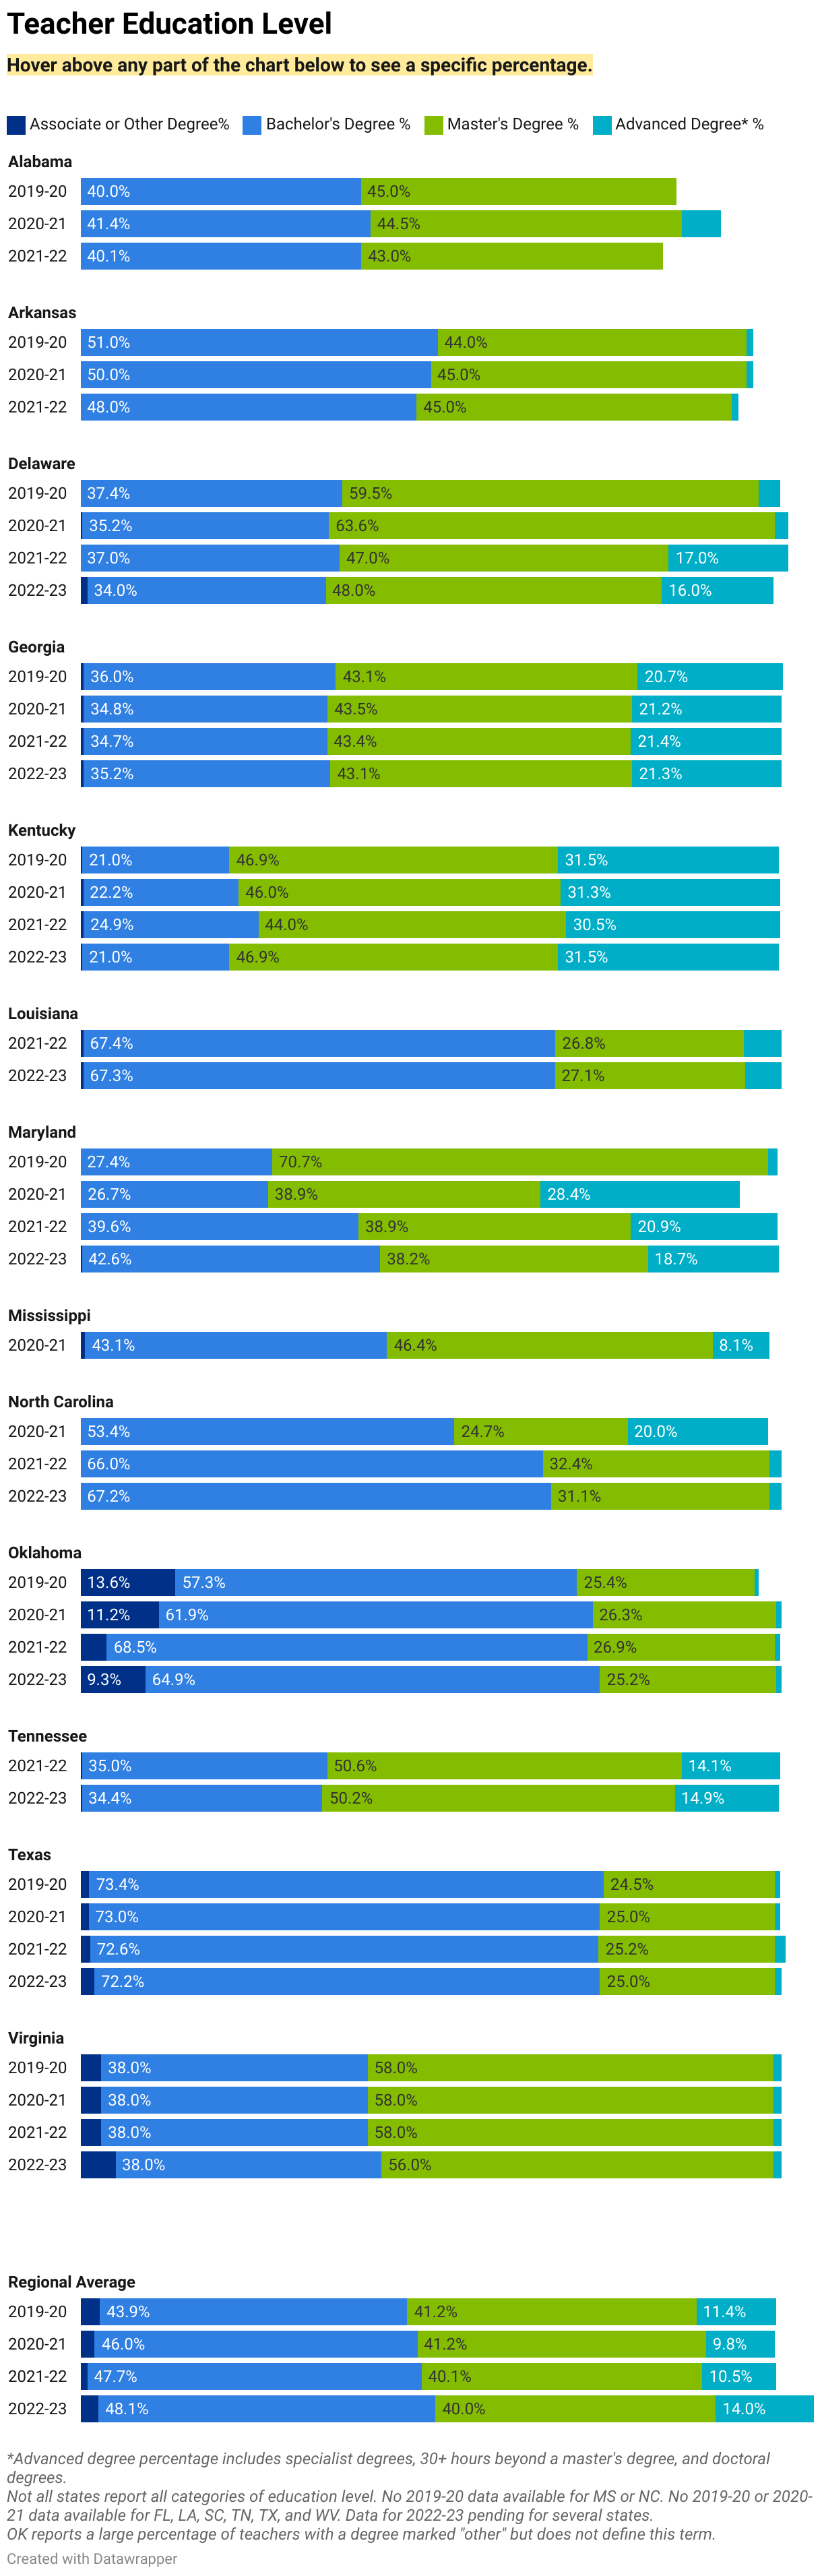
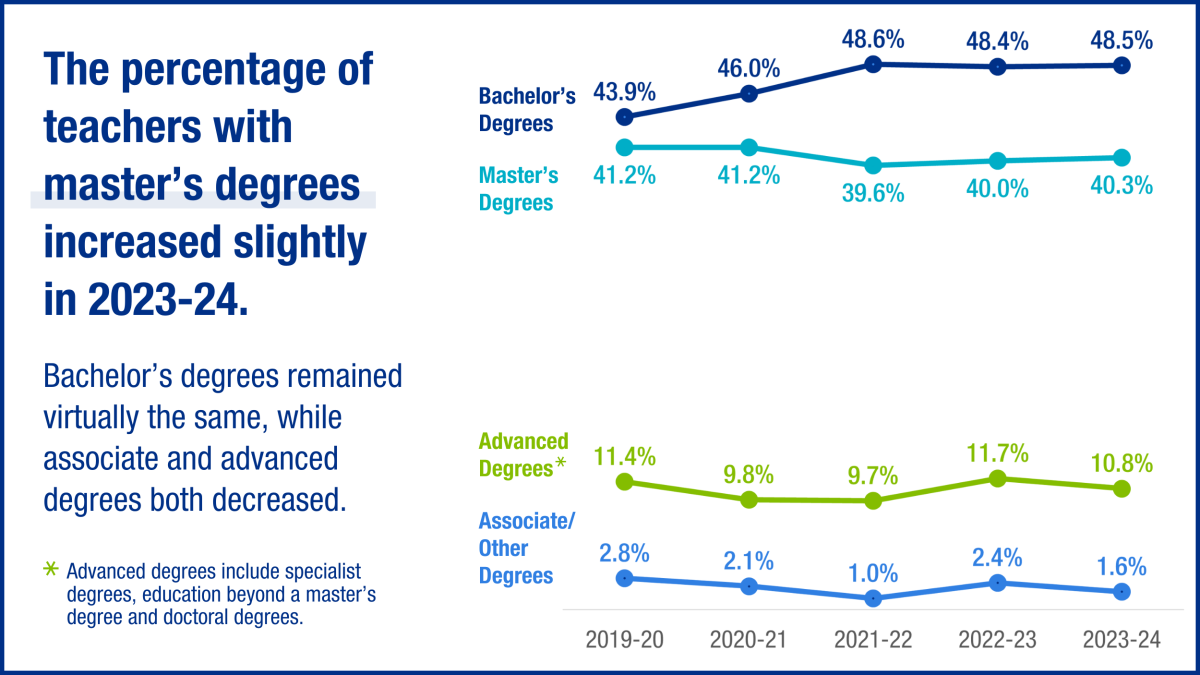
The percentage of teachers with master’s degrees increased slightly in 2023-23, while the percentage with associate degrees or advanced degrees (beyond a master’s) decreased. The percentage of teachers in the South with a bachelor’s degree remained the same.

Mirroring national demographics, a majority of teachers in the South are female. This percentage has remained extremely consistent across the last 5 years.

2023-24 marked a small increase in the percentage of teachers of color in the South — 25.3%, up from 24.8% the previous school year.

In 2023-24, there were small shifts in the racial and ethnic makeup of the teacher workforce in the SREB region — when compared to the average across the previous four years, the percentage of teachers who are Hispanic, Black, Asian, or Native American/Native Alaskan/Native Hawaiian all increased, while the percentage of teachers who are white or multi-racial decreased.

In the South, the student population is about twice as diverse as the teacher workforce. 1 in 4 teachers is a person of color, while 2 in 4 students are people of color.

In 2023-24, the percentage of teachers with master's degrees increased slightly  (from 40.5% to 40.9%). The percentage of teachers with associate degrees or advanced degrees (beyond a master's) both decreased  — from 12.2% to 11.3% and from 2.6% to 1.6% respectively. The percentage of teachers in the South with a bachelor's degree remained the same at 47.4%.


Data by State


SEE MORE STATE-BY-STATE DATA