
Building a First-Rate Teacher Workforce
Four Fundamentals of Attracting and Retaining Great Teachers — Starting with Data
Schools are faced with so many challenges and are doing the best they can to serve students. Many school leaders are trying to fill vacancies and prevent talented educators from leaving. Without enough teachers who want to keep teaching or enough people choosing to become teachers in the first place — we have a workforce and economic development problem.
In the short run, schools are having to rely on a “warm body” approach. This means focusing more on filling numerical vacancies over qualifications or preparedness to lead a classroom. These challenges are especially striking when examined by subject area and school poverty level.
Long-term, filling vacancies in this way can harm students’ learning and make teachers’ jobs harder, affecting retention. It also requires leaders and mentors to provide more to support these colleagues.
To ensure efforts to address teacher shortages are effective and long-lasting, leaders can look in-depth at various measures and take a holistic approach to making teaching an attracting and rewarding career choice.
Based on our work, SREB recommends a close look at four fundamentals to build a first-rate teacher workforce for the future:
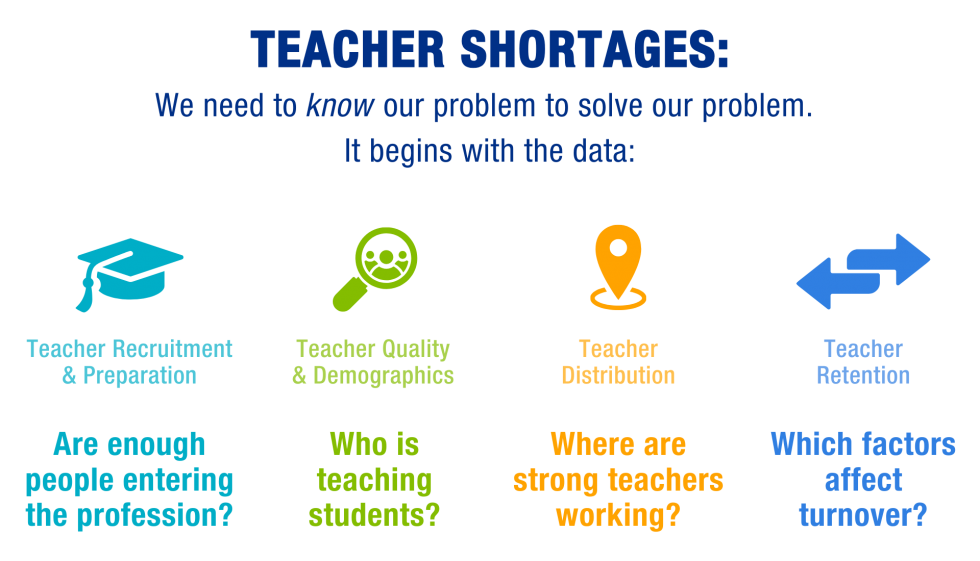
Are enough people entering the profession?
TRENDS THAT MATTER:
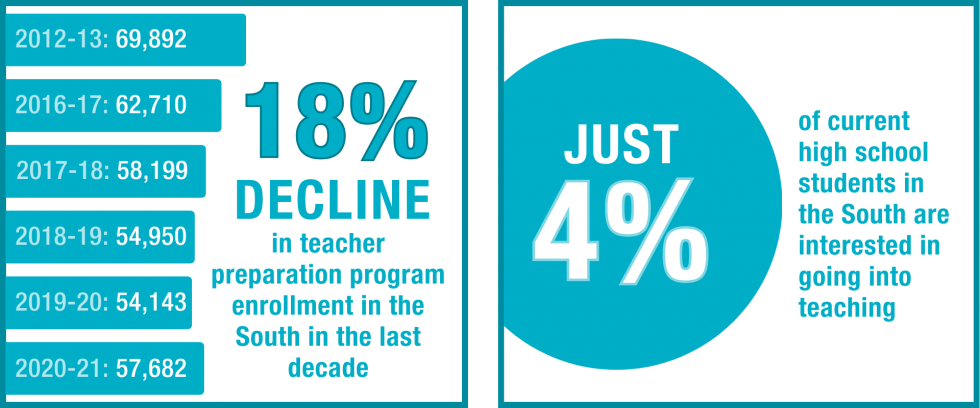
In the SREB region in 2021, turnover equated to a loss of more than 152,000 teachers from their positions. Yet we prepared fewer than 58,000 new teachers in both traditional and alternative preparation programs. Between 2012-13 and 2020-21, the number of people completing teacher preparation programs in the South declined significantly, even when factoring in the rise of alternative certification programs. The 2020-21 school year marked the first time since 2012 with an increase over the previous year.
We need more people who choose to:
- enroll in quality teacher preparation programs
- complete those programs, and
- enter the profession
Looking ahead, as Gen Z continues to enter the workforce, just 4% of high school students in the South say they would be interested in entering teaching — an all-time low. With an increasingly aging population of existing educators, it will take targeted approaches to address this generational shift.
The challenges presented by these trends are magnified when combined with others, such as increased turnover, increased vacancies and fewer qualified applicants.
DATA TO COLLECT AND EXPLORE:
✔ Projected need, including:
- The student population — such as enrollment numbers and student demographics
- Teacher turnover and retirement
✔ Potential interest in becoming a teacher — as well as general attitudes and perceptions around teaching as a career path — among middle school, high school and college students
✔ Teacher preparation program information, for both traditional and alternative programs, such as:
- Enrollment data
- Completion data
- Data on program completers who enter the profession (and those who don’t)
IDEAS FOR CHANGE:
✔ Review our teacher recruitment and preparation reports and posts.
✔ See our new report, in partnership with Vanderbilt University, about teaching interest and retention among Gen Z: Recruiting the Next Generation of Teachers
Who is teaching students?
TRENDS THAT MATTER:
Experience level and skill mastery are valuable to examine because:
- like most professions, teachers gain wisdom and skill at their craft as they get experience under their belts, and
- teacher turnover tends to be highest among early-career teachers — research suggests a turnover rate of approximately 44% during the first five years after a teacher enters the profession. SREB’s review of state-level data reports showed an increase in the percent of the teacher workforce who had less than three years of experience — 17.6% in 2020-21, up from 16.4% the prior year.
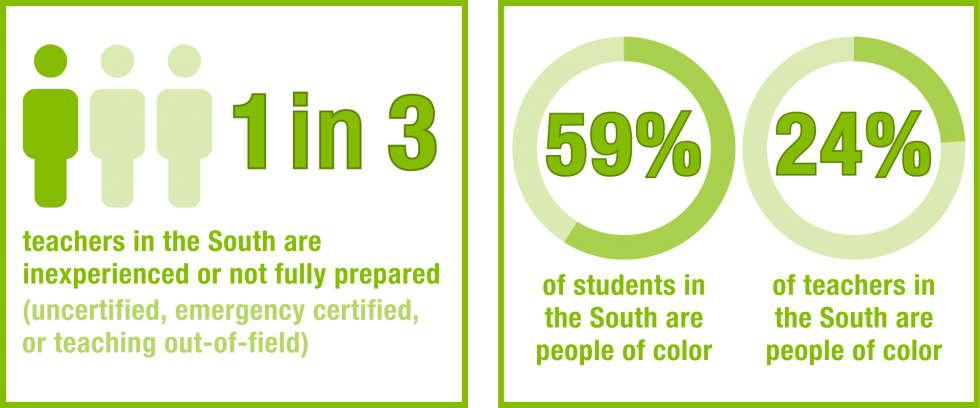
SREB’s review of state-level data also showed an increase in the percentage of uncertified or emergency certified teachers in the South during the same timeframe — 5.1% in 2020-21, up from 4.5% in 2019-20. The percentage of teachers who were teaching out-of-field remained steady at 11%.
To address teacher shortages caused by turnover, vacancies and other factors, states and districts sometimes reduce or waive requirements for certification. But some of these strategies are unsustainable — they can harm students’ learning, devalue the profession and fail to address the long-standing, systemic issues that have led to teacher shortages in the first place. Sweeping efforts to lower the standard of entry into teaching run the risk of simply increasing the number of unprepared and ineffective teachers, and they are also likely to disproportionately impact schools that serve low-income students and students of color.
When it comes to the racial and ethnic makeup of our teacher workforce, research shows that having a teacher of color can benefit students of color in several key ways, including:
- Reducing the number of absences
- Improving overall academic performance, math and reading test scores, graduation rates and aspirations to attend college
And these positive effects aren’t just limited to students of color. Research has shown that white students who had a teacher of color saw gains in math and reading when compared to other white students who were assigned to white teachers — and that these positive effects even persisted into high school.
Although the teacher workforce in the South shows signs of becoming more diverse — 24% of teachers in the region were people of color in 2020-21, up from 22% the year prior — it still doesn’t reflect the demographics of the student population.
DATA TO COLLECT AND EXPLORE:
✔ Teacher mastery, using multiple measurement points on teacher quality to identify lead and master teachers
✔ Current data and trends over time — including type and location of teaching assignments, teacher quality indicators and retention data for these groups:
- Uncertified and emergency certified teachers
- Teachers with provisional certifications or certifications from relaxed requirements
- Teachers who are teaching out-of-field
- Teachers who are ineffective and inadequately effective
✔ Teacher experience level, including the percentage who are inexperienced and the rate of teacher turnover at various levels of experience
✔ Data about race and ethnicity for both students and teachers — not only on a state-level, but on levels such as by district, ZIP code, cluster or school
✔ Data about the pass rates of teacher preparation programs and licensing exams (or other certification requirements), including by race and ethnicity
IDEAS FOR CHANGE:
✔ Explore our Blueprint to Solve Teacher Shortages for more on how to support teachers at each stage of their careers, so that they grow their skills, choose to stay in the profession and have opportunities for routes into teacher-leadership roles.
✔ Read our new report, in partnership with Vanderbilt University, about recent teacher labor market trends: Teacher Labor Markets Trends Before and After the COVID-19 Pandemic
Where are strong teachers working?
TRENDS THAT MATTER:
Teacher shortages aren’t just an issue of quantity — in many cases they are an issue of distribution. In other words, it’s not just about having enough teachers, it’s about having enough specialized teachers in the right places, and ensuring those teachers are strong teachers.
Not having enough teachers in the subject areas and locations where they are needed most means that some students are being more impacted by teacher shortages than others. For example, consider:
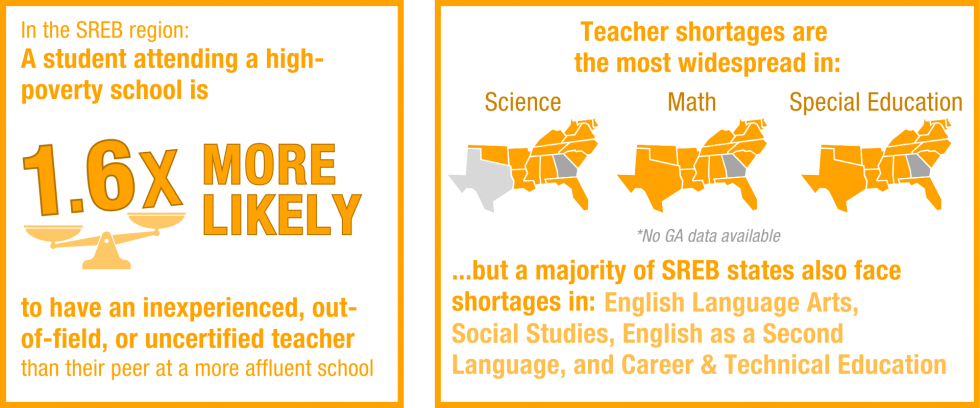
Teacher Shortages by Subject Area: Nationwide, there has been a growing misalignment between teacher supply, demand and future need. For example:
- In 2022, 48 states reported a shortage of special education teachers and schools reported special education vacancies at almost double the rate of other teaching areas. In 2020-21, 40% of schools that were hiring for open special education positions reported having difficulty filling the position — compared to 17% 10 years ago.
- Similarly, in 2022:
- 32% of schools reported having difficulty filling vacancies for math teachers, up from 19% in 2011-12.
- 31% of schools reported difficulty filling vacancies in biology or life sciences, up from 19% in 2011-12.
- 47% of schools reported difficulty filling vacancies in physical sciences (such as physics and engineering), up from 26% in 2011-12.
The long-term effects of these shortages are problematic given future economic well-being and workforce needs heavily dependent on STEM skills.
Teacher Shortages by Poverty Level and Location: It’s well documented that districts and schools with higher concentrations of students from low-income backgrounds experience greater rates of teacher turnover and staffing instability — teachers are nearly two times more likely to exit high-poverty schools than more affluent ones.
The type of community — how urban, rural or suburban it is — also correlates with teacher shortages. For example, in high-poverty, rural schools, close to one in three teachers leave. Research shows that approximately half of all teacher turnover happens in just 25% of schools, primarily urban and rural schools that serve low-income students or students of color. And it is these schools that experience the highest rates of principal turnover as well.
These realities also highlight why students deserve better than a “warm body” approach — students most impacted by teacher shortages need strong, well-supported teachers. Simply filling numeric gaps isn’t enough.
Many of the same districts and schools most impacted by shortages also have the highest rates of inexperienced and underqualified teachers. Among high-poverty, Title I schools in the SREB region in 2020-21, 19.7% of teachers were inexperienced, 13.5% were teaching out-of-field, and 9.1% were uncertified. And nationally, district leaders say that 16% of the new teachers hired in 2020-21 were not fully prepared, a nearly 80% increase from 2014-15.
Teachers in high-poverty schools may need more support (especially those who are uncertified or new to teaching), but they are less likely to get it. The Economic Policy Institute found that in high-poverty schools, first-year teachers were less likely to work with a mentor, and teachers were less likely to have professional development opportunities they found useful (such as observation visits to other schools or teacher-led research).
DATA TO COLLECT AND EXPLORE:
Teacher shortages are not monolithic. Rather than addressing them only via broad strokes, states and districts need to use data to inform approaches that are targeted to meet specific areas, needs and contexts. For example:
✔ Shortage data by subject area, including data by grade level, location and poverty level
✔ Proxies for teacher quality (such as experience level and certification type) by subject area, location and poverty level
✔ Information on teacher turnover and movement by subject area, location and poverty level
✔ Data around working conditions, compensation, burnout and professional support/development for specific groups of teachers, such as those who work in high-poverty schools, rural teachers, early-career teachers and special education teachers
✔ Trends in the effectiveness of school leaders and administrators, including how this affects teacher recruitment, morale and retention
IDEAS FOR CHANGE:
✔ Explore promising options for incentivizing current teachers or pre-service teachers to fill vacancies in subject areas and geographic areas of need.
✔ Go to our Blueprint to Solve Teacher Shortages for information on the relationship between teacher shortages and future economic and workforce needs, as well as guidance on how to customize a plan that addresses your state’s specific challenges.
✔ Stay tuned for a second SREB Blueprint report for district and school leaders on strategies to better recruit and support teaching talent.
Which factors affect turnover?
TRENDS THAT MATTER:
Teacher turnover plays a key role in the breadth and depth of shortages. Turnover disrupts student learning and affects school climate, as institutional knowledge about students and programs is lost. It’s also time-consuming and costly — on average it cost districts $21,000 to replace one teacher.
To improve teacher retention, states and districts can employ solutions that address strong instructional leadership, working conditions and competitive compensation and benefits packages. These are three of the most meaningful ways to address teacher shortages, stabilize the workforce and contribute to a strong economy in the long-term.
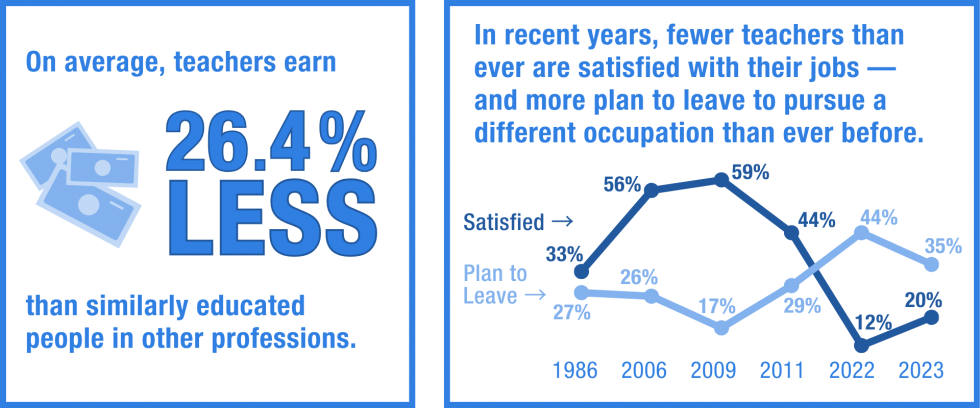
Compensation affects retention and dissuades people from entering the teaching profession. In 2022, on average, teachers made 26.4% less than their similarly educated peers in other professions and were more significantly impacted by inflation. Benefits packages, such as heath and retirement, have not been enough to offset these wage gaps. Simply put, many teachers are concerned about their financial security and do not find the pay to be commensurate with the stress of the job.
Teacher morale has steadily eroded, with record lows in teacher satisfaction and record highs in the percentage of teachers looking to leave the profession to pursue a different occupation.
This is backed up further in recent research by RAND, which found that even prior to the COVID-19 pandemic, stress topped the list of reasons teachers quit. Teachers report experiencing stress at about two times the rate of other working adults.
Teachers also noted a lack of autonomy around school policies, the resources and supplies they need to teach and student behavior. Next to pay raises or bonuses, the top levers teachers said would most improve their mental well-being and morale were smaller class sizes and more support for student discipline.
The next generation has picked up on these unfavorable working conditions. Among current high school students in the South, just 4% say they would be interested in going into teaching. The top reasons they shared include low pay, lack of career advancement, lack of flexibility and collaboration, and a lack of voice and respect.
The record-low interest in teaching among high school and college students, as well as record-low job satisfaction among current teachers, are not simply a byproduct of pandemic-related factors — they are declines that have occurred steadily over time, indicating they are part of larger structural issues within the profession.
DATA TO COLLECT AND EXPLORE:
✔ Data on overall teacher satisfaction and interest in leaving the profession — by experience level, subject area, school poverty level and other factors
✔ Compensation benchmarking data, including local “wage penalties” for teachers (compared to similarly educated professionals), the impact of inflation, and take-home pay compared to local cost of living
✔ Quantitative and qualitative feedback from teachers on working conditions, such as stress, hours, leadership, class size, student behavior, autonomy, professional support and more
✔ What teachers identify as the top levers to improve their well-being, morale and likelihood of staying
✔ Data on the frequency and nature of teachers needing to cover other classes — due to shortages and absenteeism, 64% of teachers reported being asked to cover another class at least once per week in 2022
IDEAS FOR CHANGE:
✔ Explore the SREB teacher compensation dashboard for a closer look at each state’s teacher compensation packages, including salaries, retirement benefits, health benefit options and take-home pay. You can also read trends and highlights from an analysis of the dashboard.
✔ Examine successful strategies for retaining talent in different environments, such as administrative leadership training, teacher-leadership pathways, mentoring and climate.
✔ Stay tuned for a new SREB report in 2024 about creating teacher career entry and advancement pathways.