Topic: Teacher Shortages
Teacher Workforce Shortages
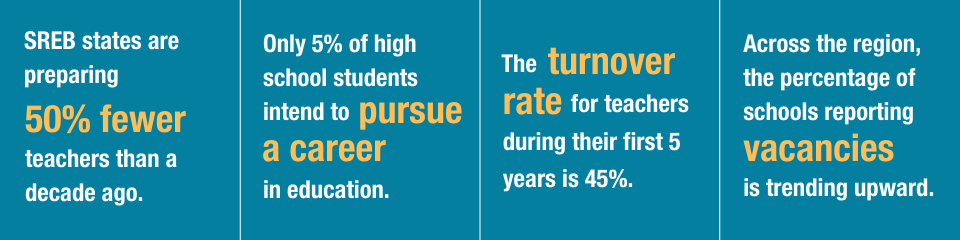
Every student deserves a great teacher — but teacher shortages hurt education and the economy. Teachers are one of the most influential factors in a child’s learning. And collectively, the teacher workforce helps to prepare workers for all other industries.
But across the Southeast, teacher shortages harm student learning, deepen inequities, compound the challenges teachers face, and cause economic disadvantages.
HOW CAN STATES REVERSE THESE TRENDS?
To elevate the profession and address teacher shortages, states should:
1. Understand the data. Data is a valuable tool to help inform both policy and practice. Regional and state data can paint a picture of teacher workforce strengths, challenges, and trends.
2. Design a comprehensive blueprint. When renovating teacher workforce policies, consider the big picture rather than individual pieces in isolation. Design policies for preparation & pathways, licensure, professional support, and compensation together as an interlocking system.
3. Ensure policies support each stage of a teacher’s career. Aligning policies from preparation through classroom teaching and leadership opportunities can help make teaching a more attractive and sustainable profession.
Systems of Support for Teachers and Leaders
Learn how school districts can provide well-rounded support for educators at all levels, uplifting the profession and positively impacting students.
A State Guide for Innovative, High-Impact School Staffing Systems
 Traditional school staffing models have remained largely unchanged for decades. Strategic school staffing offers a path forward that is tailored to today’s instructional demands, labor market realities and the needs of the current generation of students.
This policy guide provides legislators, state boards of education, state agency leaders, governors’ offices and district policy leaders with a practical framework for addressing barriers, enabling high-quality implementation, and helping districts to scale up thoughtfully-designed strategic staffing models.

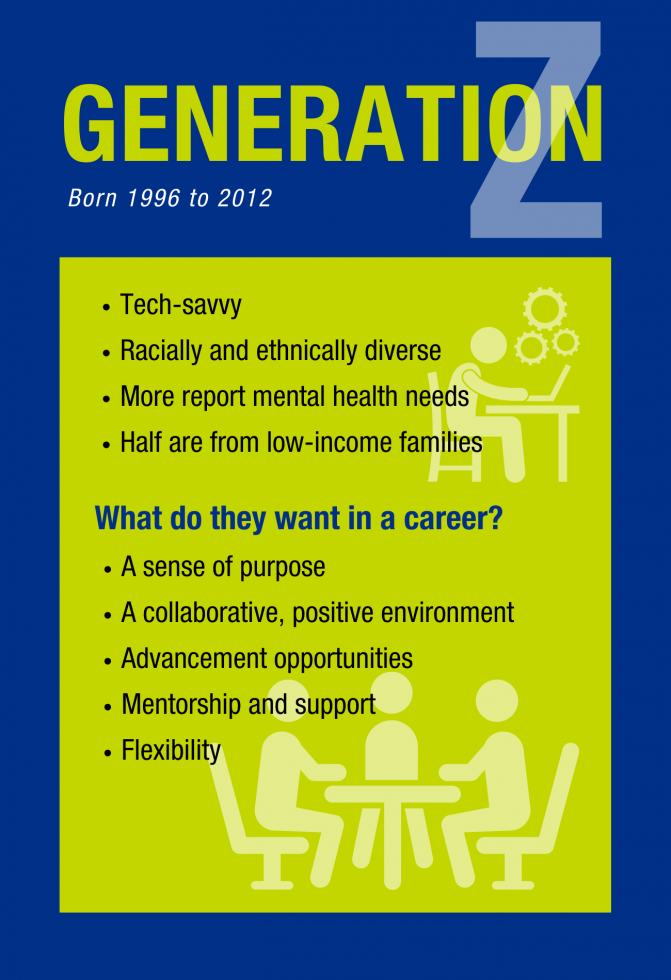
How to Attract and Retain Generation Z Teachers
SREB partnered with Vanderbilt University to conduct several research studies on Gen Z educators and current challenges attracting and retaining young professionals in K-12 education. In this brief, the research team shares key findings and examines four areas that state policy can focus on to recruit and retain more Gen Z teachers into the classroom — ultimately increasing workforce stability and student achievement.
Further Insights into Gen Z Teacher Experiences
Longitudinal Study
 As baby boomers retire and occupational mobility increases in our society, education leaders increasingly look to younger professionals to fill the growing number of teaching vacancies. Yet the newer generation is vastly different in many ways to previous generations.
The Southern Regional Education Board interviewed Gen Z teachers and teacher candidates again, for further insight into Gen Z and their experiences and thoughts on the teaching profession today.


Educator Insights on How to Save the Teaching Profession
Educators are at the heart of serving students—and they have ideas that can transform their own profession. At the SREB Summer Conference, we asked teachers, coaches, counselors and administrators from around the South a simple but powerful question: What would it take to make teaching more attractive and sustainable? Through on-camera interviews, focus groups, and surveys, educators shared their honest perspectives on the challenges they face today and their solution ideas for the future.

Mentoring New Teachers
Invest in Educators Series
This guide provides support for mentors and outlines best practices for teacher induction using the SREB Teacher Induction Framework.

From Student to Teacher
How GYO Programs Foster Local Talent in Education
This brief was written by Joseph Tadlock, SREB director of research and evaluation, and Megan Boren, SREB director of educator workforce.
In this brief, we explore the different types of grow your own teacher programs, provide evidence of their effectiveness, and discuss how these programs could reshape new teacher induction.

Teacher Induction Policies
This policy brief examines current state requirements for teacher
induction,
spotlights states and programs with exemplary components and
impact, and
introduces different funding models for induction. It also
highlights several
policy recommendations for high-quality teacher induction.


Making Education a Competitive Career
In this clip from SREB’s Teacher Workforce series, education professionals highlight the financial challenges schools face in attracting and retaining talented educators, especially those coming from higher-paying industries. Fair, livable compensation is critical to making education a viable, long-term career.
View the full video.

Professional Pay for the Teaching Profession
In this clip from SREB’s Teacher Workforce series, education professionals discuss how increasing teacher pay has helped bring more applicants into the profession.
View the full video.

Teachers Can Inspire Students to Become Teachers
In this clip from SREB’s Teacher Workforce series, education professionals reflect on the importance of showing students that teaching can be a meaningful and rewarding career. They emphasize inspiring future educators early and highlighting the impact teaching can have on students’ lives.
View the full video.

Strengthening the Teaching Pipeline With Paid Residencies
In this clip from SREB’s Teacher Workforce series, education professionals discuss the value of longer teacher residencies. Spending a full year in the classroom, with support to make it financially feasible, helps new teachers gain experience and stay in the profession.
View the full video.

Thoughts on Teacher Training and Development
In this clip from SREB’s Teacher Workforce series, education professionals highlight the importance of instructional coaching and mentoring. Supporting new and experienced teachers through paid professional development can strengthen the workforce and help more educators succeed.
View the full video.

Investing in Education Resources
In this clip from SREB’s Teacher Workforce series, educators call attention to the funding challenges schools face. From classroom resources to support services and fair pay, they emphasize that expectations for teachers and students must be matched with the funding needed to meet them.
View the full video.

Challenges of the Profession: Job Satisfaction
In this clip from SREB’s Teacher Workforce series, an educator reflects on the importance of teachers valuing themselves, noting that fostering respect and satisfaction in the profession is essential to inspiring the next generation of educators.
View the full video.

The Principal Effect
In this clip from SREB’s Teacher Workforce series, educators emphasize the impact of strong leadership on schools. Effective principals can transform the teaching experience, while investing in leadership development helps build a workforce where teachers can thrive.
View the full video.


Pathways and Retention for New Teachers
Insights from Southern States
 Early-career teachers are entering the profession via an expanding variety of pathways. Do certain pathways provide more support than others? Do some entry routes into teaching yield higher rates of teacher retention? Why has early career teacher retention dipped so low and what can we do to change that?
A research partnership between SREB and Vanderbilt University explores these questions and more by analyzing state administrative data, survey results, and teacher interviews across three states in the South.

 Explore regional highlights, state-by-state data collections, and spotlights of promising state practices from across the South. Data include various measures of teacher quantity, preparation, demographics, shortages, quality, and talent distribution from 2019-2023.
Teacher Labor Market Trends
Insights From Two Southern States
Teacher shortages, high turnover rates and declining interest in the teaching profession have proven difficult for policymakers to address. These concerns are even more dire in Southern states.
Partnering with researchers at Vanderbilt University’s Peabody College of Education, SREB studied data in Kentucky and Tennessee on teacher labor market trends over the last decade. This online report features seven findings with interactive charts.
The Next Generation of Teachers
A Study of Generation Z’s Interest in the Teaching Profession
We depend on Generation Z to fill the growing number of teaching vacancies. Partnering with researchers at Vanderbilt University’s Peabody College of Education, SREB studied data in Kentucky and Tennessee for insight into Gen Z and their interest in the teaching profession. This online report features six findings with interactive charts.
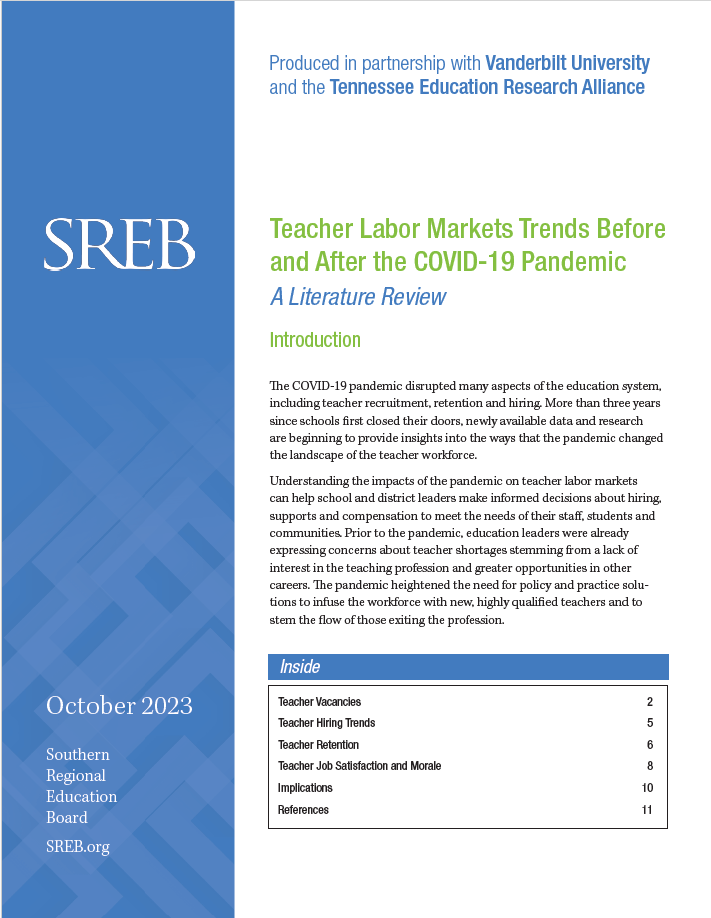
Teacher Labor Markets Trends Before and After the COVID-19 Pandemic
A Literature Review
The COVID-19 pandemic disrupted many aspects of the education system, including teacher recruitment, retention and hiring. More than three years since schools first closed their doors, newly available data and research are beginning to provide insights into the ways that the pandemic changed the landscape of the teacher workforce.
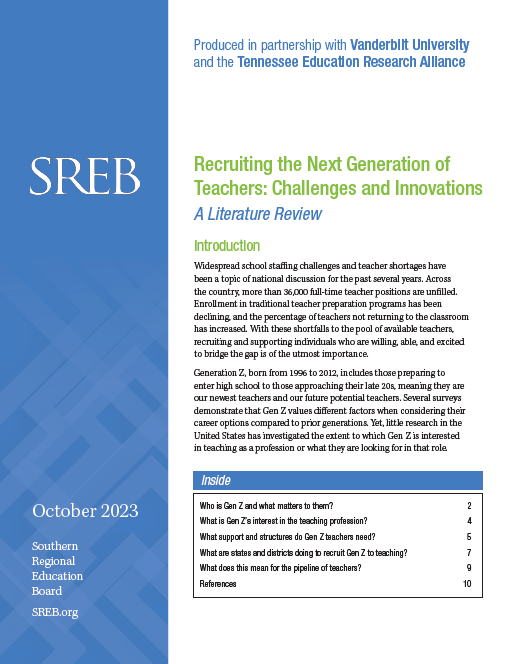
Recruiting the Next Generation of Teachers: Challenges and Innovations
Crafting programs and policies that address the teacher workforce requires knowledge of Gen Z, their interest in entering the teaching profession, and how to support them as new teachers. In this brief, the research team reviewed the literature on Gen Z’s background, interest in teaching as a profession, and what states and districts are doing to try and recruit them.
Building a First-Rate Teacher Workforce
Four Fundamentals of Attracting and Retaining Great Teachers — Starting with Data
 Districts and schools are having to rely on a “warm body” approach to address teacher shortages, focusing on filling numerical vacancies over teacher qualification or preparedness. But taking a closer look at four data categories can make efforts to solve shortages more effective and longer-lasting.

Teacher Workforce Data Summary
SREB Region At-A-Glance, 2019-20
 This 1-page fact sheet shares a summary of teacher workforce data in SREB states — including a snapshot of teacher preparation, certification, compensation, diversity, turnover, and shortages.